eCommerce Business Metrics to Watch Out For In 2022

When trying to figure out which indicators and numbers reflect your business’s progress best, it’s easy to get a bit lost in the terminology, or focus on tracking the metrics which are not optimal for keeping on top of your brand’s performance.
Whether or not you’re working with a marketing team, - which we highly encourage - in this article we’ve attempted to explain what KPIs are, and help you gain some in-depth knowledge on your eCommerce metrics to be more informed going forward.

Contents:
What is a metric?
To put it simply, a metric is a comprehensive measurement you need to keep track of to stay informed about a certain aspect of your business activity, and measure how it reflects on your company’s stats overall. Metrics are quantifiable, and they allow you to put the progress down in numbers, which helps accurately gauge how well your current tactics are performing in regards to a set target.
Metrics are different for each business, and range from a straightforward figure like the number of app downloads to something significantly more complex - the lifetime value of the average customer in relation to company’s client retention spending.
Point is - metrics usually stay consistent throughout a business’s lifetime, and reflect the eCommerce brand’s performance overall, sometimes divided up into several areas of interest. They’re crucial to understanding what your company’s strong points are, and being aware of where you’re lacking.

What is a KPI?
A KPI, or Key Performance Indicator, is also a form of measurement. Like metrics, KPIs must be well-defined, and also easily quantifiable.
The difference is - these types of measurements relate to a specific strategic business goal and reflect how successful the business is in achieving that. Basically, KPIs define a set of values against which the metrics are measured - it’s an indicator of your business’s goal that other performance metrics relate to.
Examples of KPIs include figures like the target percentage increase in market share for the business, or the increase in company’s revenue over a specific period of time which you’re aiming for. KPIs are meant to reflect your goals, and state particular numbers you would like to achieve for your brand - preferred audience growth, increased number of leads or quota for hired specialists.
What’s the difference between a metric and a KPI?
The easiest way to understand the difference between metrics and KPIs is to first recognize them both as a quantifiable measurement of strategic or tactical activity. In most cases, it is widely accepted that KPIs are strategic, and metrics are tactical in nature.
Once you clearly define how short-term performance and long-term goal measurements relate to each other, they become more intuitively distinguishable.
KPIs are quantifiable or measurable values that reflect a business goal or objective (strategic), and how successful the brand is in accomplishing that. A metric also shows a certain value in numbers, but it mostly highlights how effective the current activities taking place are (tactical), which show the company’s growth and the progress in hitting the KPIs.
Why is this important for measuring the eCommerce business’s progress?
The real value lies in the insights you get from analyzing the data, to take meaningful action at the right time. You’ll be able to more accurately develop and gauge your eCommerce strategy, drive more online sales, as well as understand where to look out for specific recurring issues.
Moreover, if the data related to KPIs is recorded and delivered in a comprehensive way, it can be effectively distributed to the team at large. Keeping the employees in the loop regarding the main company performance metrics can help educate the less experienced specialists and come together for critical problem-solving.
The risk with any business is misinformation. You might feel like things are going well on the surface, only to find out that your business has been critically underperforming.
Since you’re not keeping track of a handful of essential KPIs, you’ll be left guessing as to what caused these issues; meanwhile, your more diligent competition will inevitably win over the market.
If you’re unable to accurately gauge the results of any business strategy, you won’t have the option to stay on top of your brand’s progress, and therefore never reach your eCommerce company’s goals in any meaningful measure.
Which are the most important metrics for an eCommerce business in 2022?
Shopping Cart Abandonment Rate
This figure reflects the percentage of online shoppers who add items to the shopping cart on your business’s platform, but eventually abandon it before completing the purchase. It shows the relative number of interested potential customers who leave without buying anything, compared to the total amount of shopping carts created.
How to calculate the Shopping Cart Abandonment Rate?
The shopping cart abandonment rate is calculated by dividing the number of completed purchases by the number of shopping carts created. To turn the rate into a percentage, subtract your number from one, and then multiply it by one hundred:
For example, if you have 50 completed purchases from 250 shopping carts created, the shopping cart abandonment rate would be 80%: 1 – (50 ÷ 250) x 100 = 80%
Average Order Value (AOV)
This number shows the average amount customers spend when they make a purchase from your website, in dollars. This metric helps online retailers understand customer behavior, and take action to increase the sum shoppers spend on a single order.
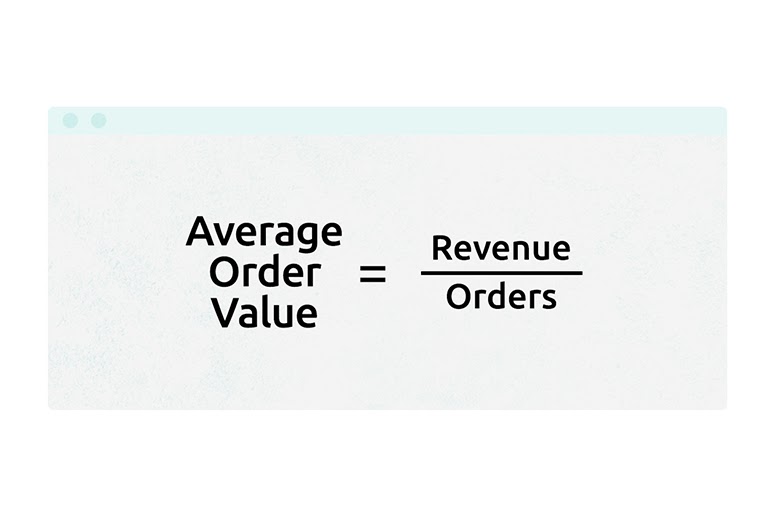
How to calculate Average Order Value?
The Average Order Value is calculated by dividing the total revenue by the number of orders placed. This metric is most often calculated monthly (i.e. total revenue for the month divided by the number orders placed that month), but it can also be tracked weekly or even daily, depending on the incoming amount of sales.
For instance, if your total revenue this week is $4000 from 160 orders, your AOV would be $25. $4000 / 160 = $25
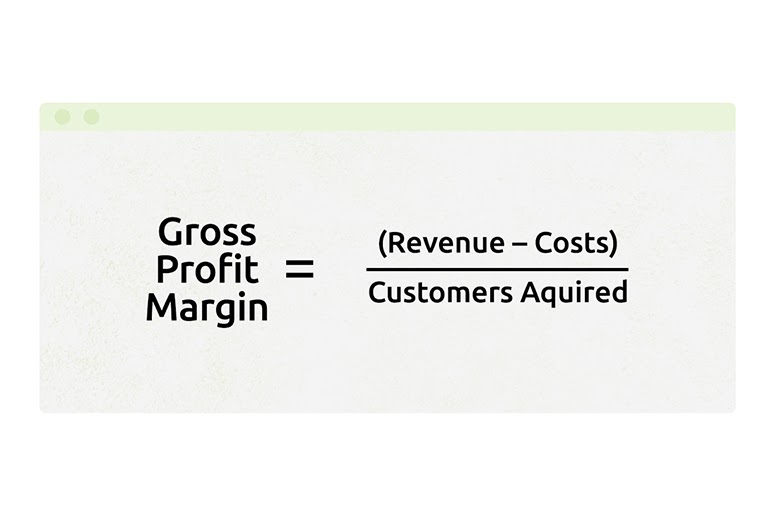
Gross Profit Margin
Also at times referred to as Gross Margin - this is the percentage of revenue that signifies actual profit, before adjusting for operating costs such as marketing, overhead, and salaries. It is crucial to see the difference between the total business’s income and profit, as only the latter actually reflects your brand’s financial success.
How to calculate Gross Profit Margin?
Calculate your Gross Profit Margin by first subtracting the cost of goods sold (COGS) from your total revenue. You can select any time period such as daily, weekly, monthly, etc., and highlight a specific product or category. Then, divide the resulting gross profit by the total revenue and multiply by 100 to generate your gross profit margin (%).
If your total revenue this week is $1000 and your cost of goods sold is $700, then your Gross Profit Margin would be 30%. The Gross Profit in this example is $300. [ $1000 - $700 ] / $1000 x 100 = 30%
The Percentage of Returning Customers
This is the ratio of people who’ve completed their initial single purchase to the customers who come back to spend their money on your product several times after, or even become your loyal clients. This is the percentage of repeat customers.
How to calculate the Percentage of Returning Customers?
To calculate the Percentage of Returning Customers, simply divide the number of return customers by the total number of customers and multiply by 100 to convert to a percentage. This can be calculated based on a variety of time frames such as daily, weekly, or monthly.
(#) Returning Customers / (#) Total Customers X 100 = (%) Percentage of Returning Customers
For example, if you have 2000 customers complete a purchase in the past week and 500 of them were returning customers, your Percentage of Returning Customers is 25%
Customer Acquisition Cost (CAC)
This is the average expense of gaining a single customer. This metric includes marketing and sales spendings, as well as salaries and overhead associated with attracting and converting a visitor to a buyer.
How to calculate the Customer Acquisition Cost?
The cost of acquiring a customer is simply the sum of all marketing and sales expenses (including salary and overhead costs) over a given period divided by the number of new customers during that same period.
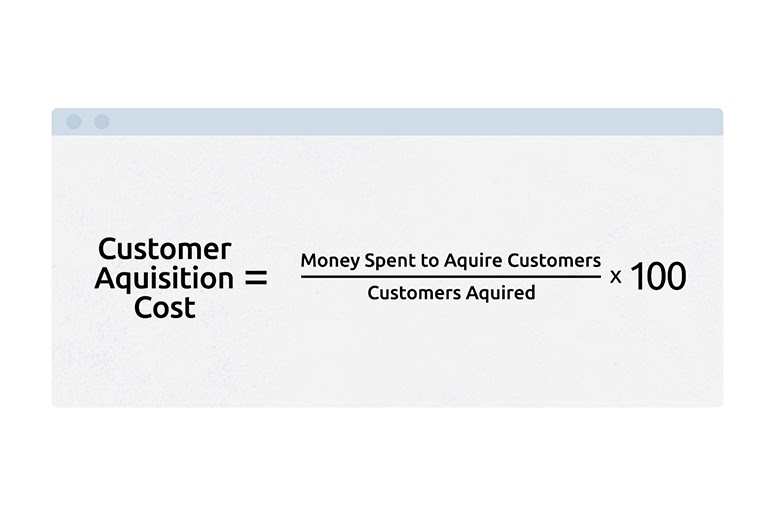
As an example, if you spent $15,000 in the past month to acquire new customers (including marketing, sales, salaries, and overhead costs) and had 1000 purchases from new customers, your CAC would be $15.
Revenue by Traffic Source
This is a breakdown of total revenue by channel, such as social, organic search, paid search, referral, etc. It highlights the most valuable options and sources that direct traffic to your eCommerce site or mobile app, which in turn helps you spend the marketing budget more effectively.
How to calculate Revenue by Traffic Source?
In order to track Revenue by Traffic Source, you’ll need to use an analytics tool (such as Google Analytics or something similar) and set up eCommerce tracking according to the Google Guide.
Once each transaction is being tracked, you can breakdown your revenue by the various online sites and sources that direct traffic to your site.
Cost of Goods Sold
The cost of goods sold (COGS), also referred to as the cost of sales or cost of services, reflects the amount of money it takes to produce your products or services. COGS includes material and labor expenses that go into the production of each good or service that is sold.
How to calculate the Cost of Goods Sold?
When calculating the cost of goods sold, do not include the cost of producing products or services that you don’t sell. To find the cost of goods sold during an accounting period, use the COGS formula:
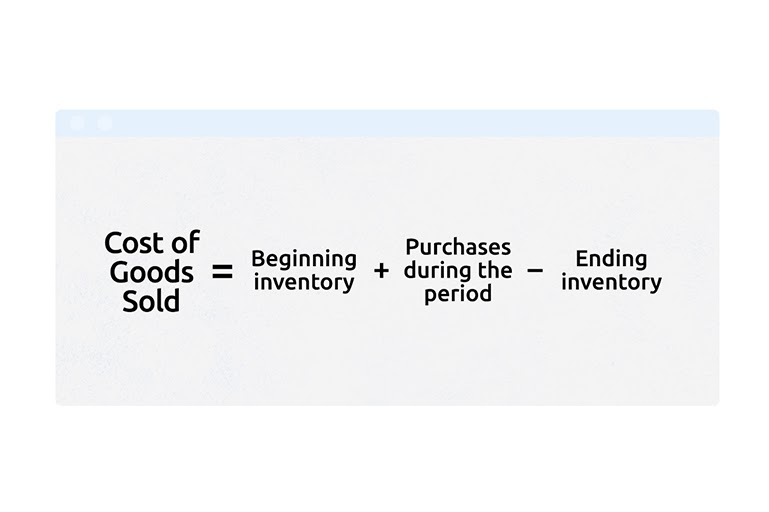
For instance, your business has a beginning inventory of $9,000, makes purchases valued at $5,000, and is left with an ending inventory of $2,000. Use the COGS formula.
COGS = $9,000 + $5,000 – $2,000
COGS = $12,000
Your cost of goods sold for the year is $12,000. Knowing this number helps you make informed business decisions, such as finding new vendors with better direct material prices, cutting down on production costs or increasing the end price for your product - to increase your eCommerce brand’s revenue long-term.
Now that you know your COGS, you can find out your business’s gross profit for the particular period. Let’s say you’ve generated $50,000 in revenue. Subtract your COGS of $12,000 from $50,000, which means that your gross income totals to $38,000.

All in all, KPIs for eCommerce businesses can feel confusing, overwhelming, and frustratingly difficult to apply at first, especially if your business lacks in marketing experts that are comfortable with monitoring all sorts of analytics and metrics. However, the time and effort you put into understanding these figures will have a drastically positive effect on your business awareness.
Learning about the relationships between the core components and metrics reflecting the performance of your business will enable you to make informed, objective decisions in regards to your eCommerce platforms’ future.
If you’re aware of your brand’s strong points, as well as stay in touch with the aspects where it’s lacking, you’ll become empowered to introduce tweaks and changes that could drastically improve the business’s revenue long-term.
Working on gaining an understanding of the numbers reflecting your eCommerce brand’s progress is a crucial element of growth for any business leader - hopefully, we’ve been able to help you get started.