Retail Business Intelligence: How to Turn Store Data Into Better Decisions

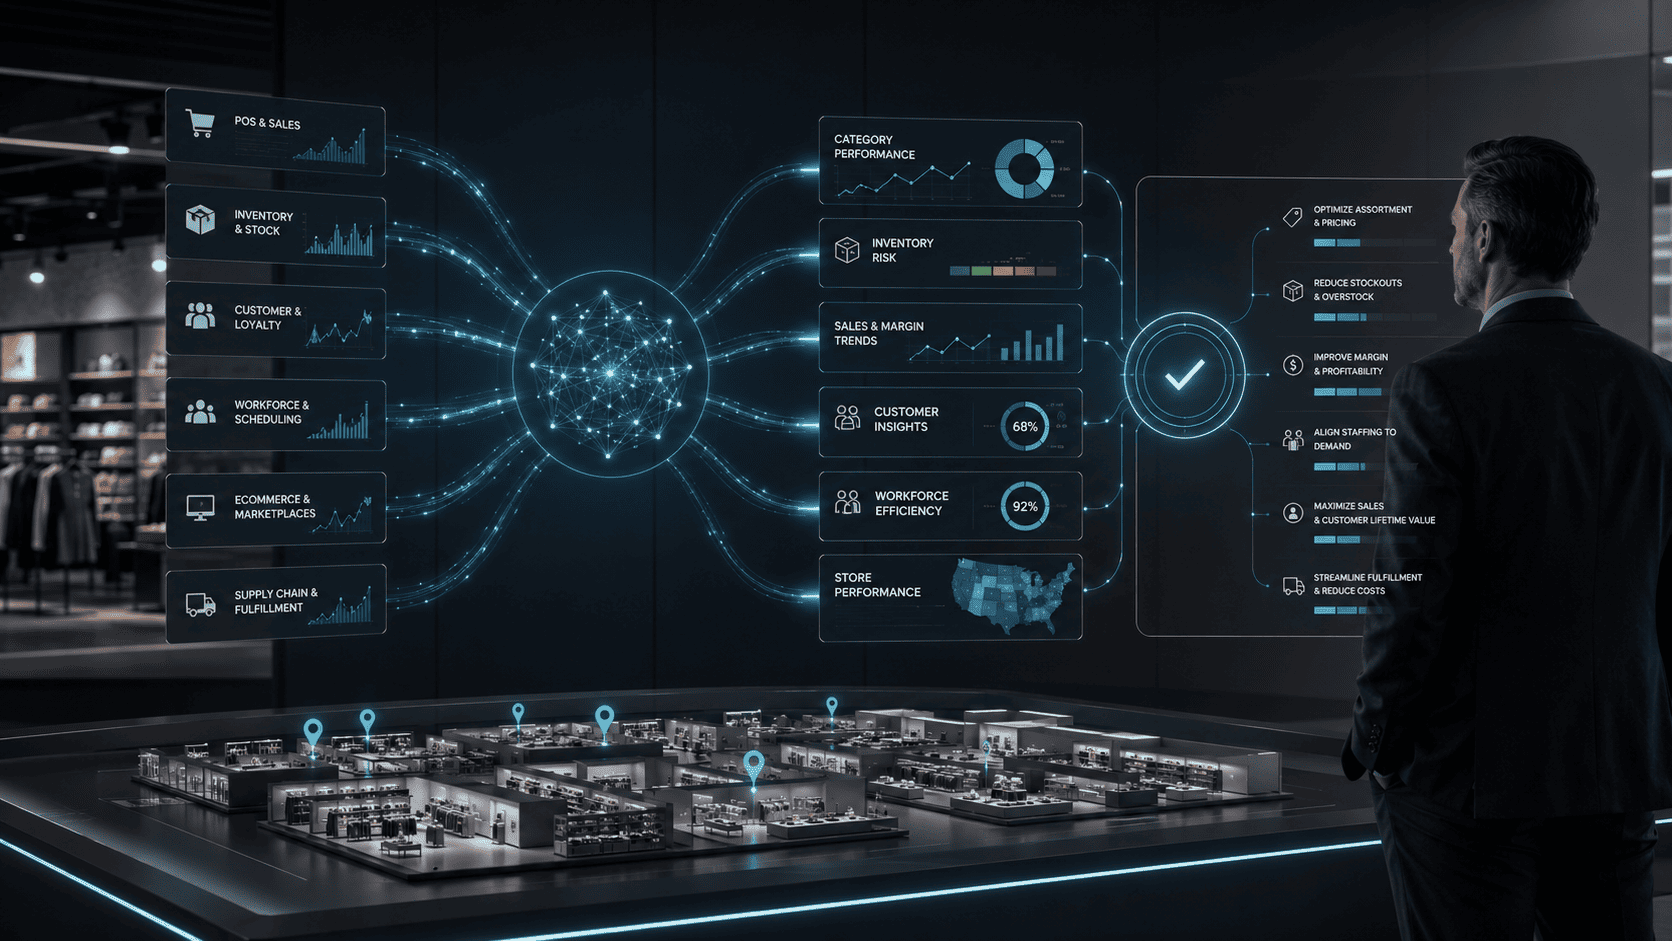
Retail business intelligence turns sales, inventory, customer, workforce, and store operations data into decisions that managers can act on. The goal is not to collect more reports. It is to help a buyer adjust an order, a store manager correct a labor gap, a merchandiser review a weak category, or an executive decide where to invest.
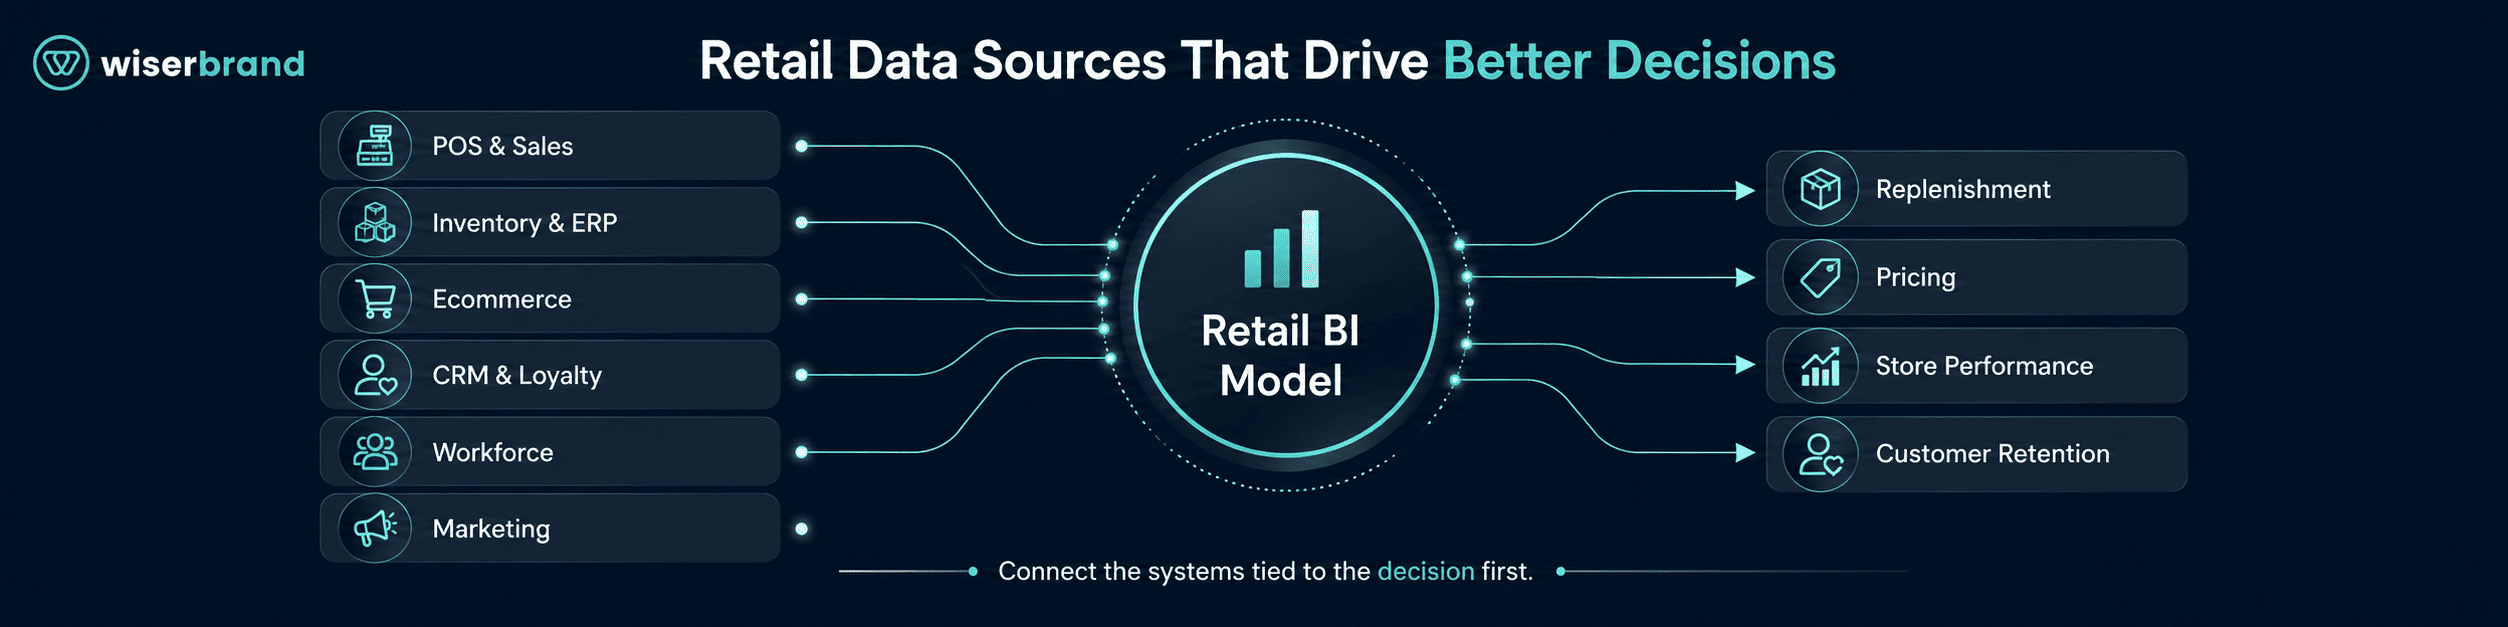
Most retailers already produce the required data. Point-of-sale systems record transactions. ERP and inventory platforms track stock. Loyalty programs capture customer behavior. Workforce systems show schedules and labor cost. Ecommerce platforms add online demand, returns, and fulfillment data. The problem is that these systems often describe different parts of the business with inconsistent definitions and refresh cycles.
A useful retail BI setup brings those records into a shared model, defines the metrics, and delivers the right signal to the person who owns the decision. This guide explains which store data matters, which metrics belong on retail dashboards, how to build the data flow, where analytics and AI help, and which controls keep the results trustworthy.
What Is Retail Business Intelligence?
Retail business intelligence is the process of combining retail data, applying consistent business definitions, and presenting the result through dashboards, alerts, reports, and analysis tools. It helps teams understand what happened, identify why performance changed, and choose a response.
A retail BI system may compare sales across stores, districts, product categories, time periods, or channels. Microsoft’s Retail Analysis sample for Power BI uses measures such as sales, units, gross margin, variance, new-store performance, and sales per square foot to examine performance across stores and districts.
The dashboard is only the visible layer. Behind it, the business needs data connectors, transformation logic, metric definitions, refresh schedules, access controls, and owners. Without that foundation, business intelligence in retail becomes another set of reports that teams debate instead of use.
Which Store Data Should Retailers Connect?
Retail decisions cross systems. A sales decline may come from low traffic, poor availability, weak conversion, pricing, staffing, or a promotion that attracted the wrong demand. One source rarely explains the full result.
| Data Source | Typical Records | Decisions It Supports |
|---|---|---|
| Point of sale | Transactions, units, discounts, returns, tenders | Store performance, category performance, promotion analysis |
| Inventory and ERP | On-hand stock, purchase orders, transfers, supplier lead times | Replenishment, allocation, stock risk, vendor review |
| Ecommerce and order management | Online sessions, carts, orders, cancellations, fulfillment status | Omnichannel demand, conversion, fulfillment, channel profitability |
| CRM and loyalty | Customer identity, purchases, segments, offers, redemptions | Retention, customer value, campaign targeting |
| Workforce management | Schedules, hours, roles, overtime, attendance | Labor planning, productivity, service coverage |
| Merchandising and PIM | Product attributes, categories, prices, markdowns | Assortment, pricing, catalog quality |
| Marketing platforms | Campaign spend, traffic, coupons, attribution data | Promotion performance, acquisition efficiency |
| Customer service | Tickets, reasons, satisfaction, resolution data | Product issues, policy friction, service quality |
| Store sensors or footfall systems | Visits, dwell, queue, zone traffic | Conversion, layout, staffing, queue management |
| Finance | Revenue, margin, operating cost, rent, shrink, cash | Store economics, profitability, investment decisions |
AWS describes retail data platforms as a way to collect, analyze, and distribute information across the retail enterprise, creating a base for BI, machine learning, and AI. The architectural point is important: data needs to move across teams while preserving definitions, permissions, and lineage.
Connecting every source on day one is rarely necessary. Start with the sources required for a specific decision. Add complexity after the first workflow proves useful.
From Store Data to a Decision
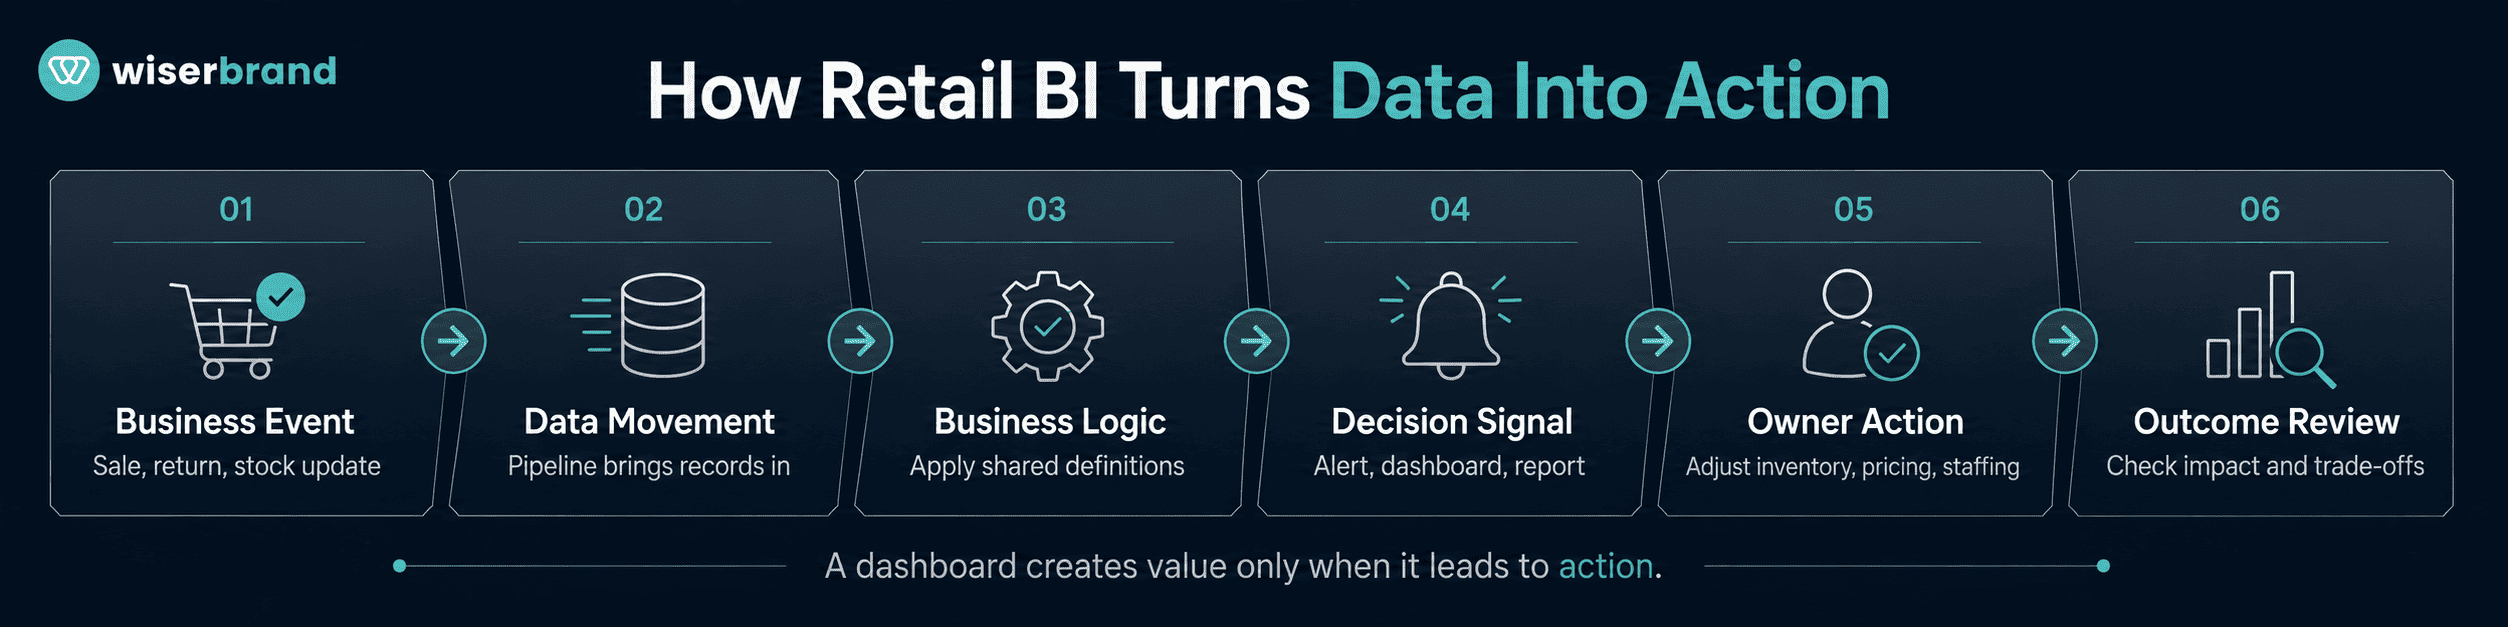
A dashboard does not create a decision by itself. A clear data strategy connects retail metrics with business owners, decision windows, thresholds, and specific actions. Retail BI creates value when a signal reaches an owner while there is still time to act.
A practical data-to-decision flow has six parts:
- Business event: a sale, return, stock update, schedule change, campaign response, or customer interaction occurs.
- Data movement: the source record reaches the analytics environment through a batch or event-driven pipeline.
- Business logic: transformations apply agreed definitions for sales, margin, availability, customer, and store hierarchies.
- Decision signal: a dashboard, alert, or scheduled report shows a meaningful change against a target or baseline.
- Owner action: a named person changes inventory, pricing, staffing, promotion, or another operating decision.
- Outcome review: the team checks if the action improved the target metric without harming another part of the business.
For example, “Store 18 sales declined” is a report. “Store 18 lost sales in two promoted categories because on-shelf availability fell below target during weekend traffic peaks” is a decision signal. The second statement points to inventory allocation, replenishment timing, and store execution.
The Retail Metrics That Actually Matter
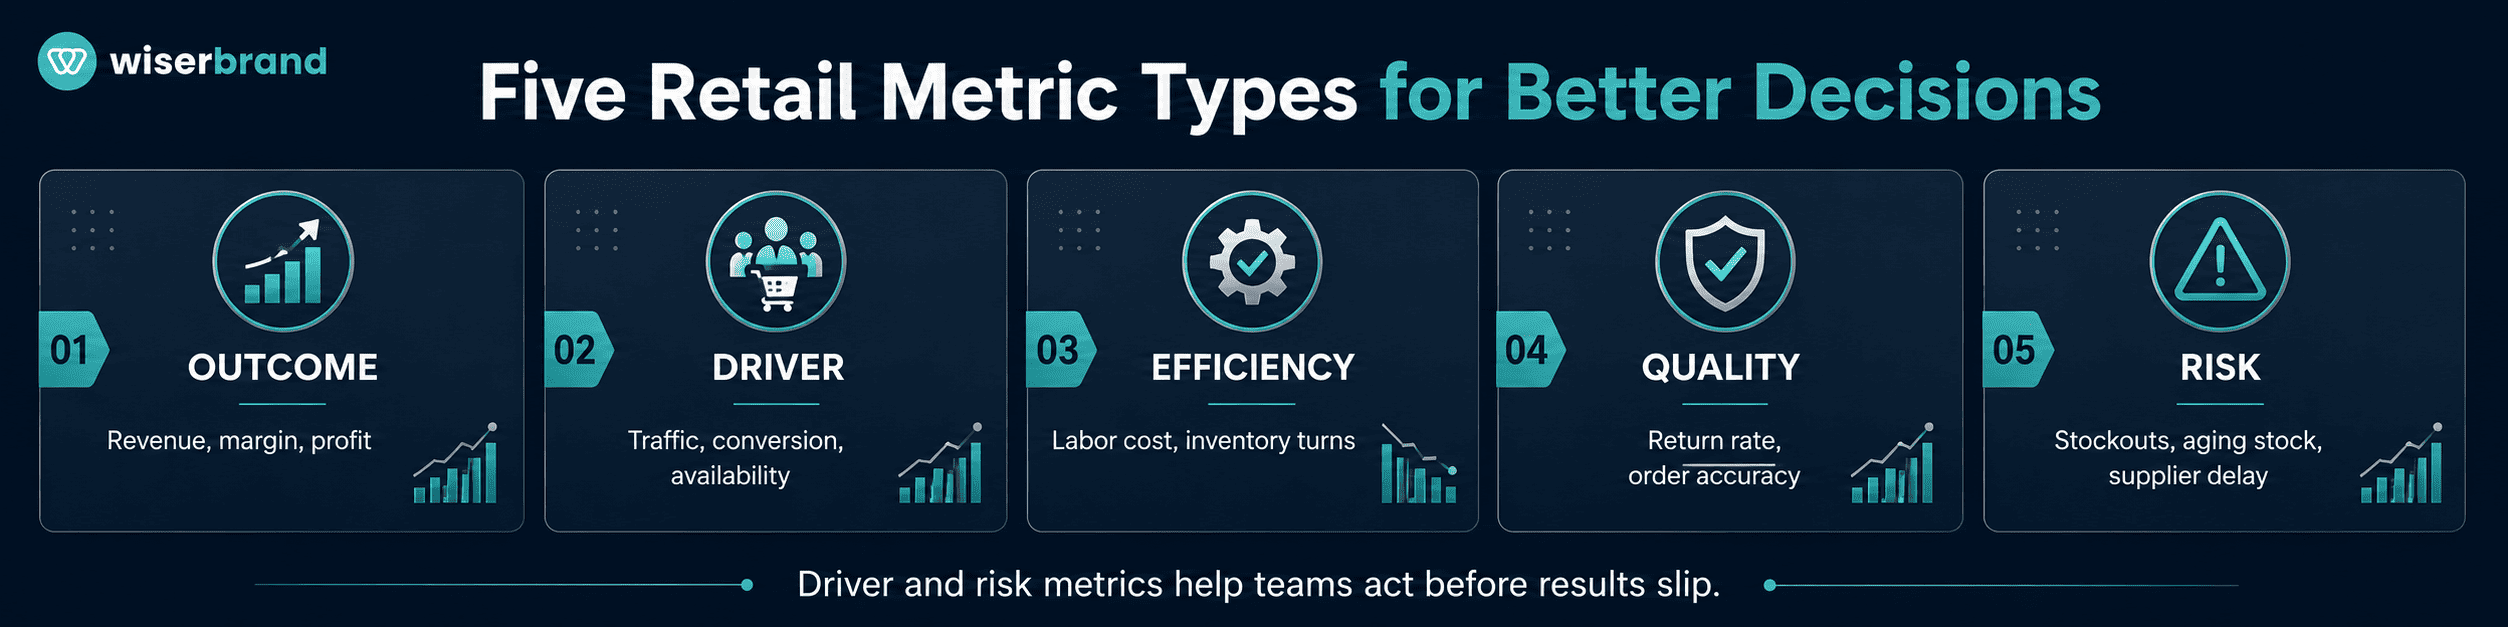
The right metrics depend on the decision. A store manager needs daily operating signals. A category manager needs assortment and margin performance. An executive needs portfolio-level growth, profitability, and risk.
A strong retail dashboard balances five metric types:
| Metric Type | Purpose | Retail Example |
|---|---|---|
| Outcome | Shows the final result | Revenue, gross margin, profit, retention |
| Driver | Explains what moves the result | Traffic, conversion, availability, average basket |
| Efficiency | Shows resource use | Labor cost per transaction, inventory turns |
| Quality | Shows process health | Return rate, order accuracy, on-shelf availability |
| Risk | Shows potential future loss | Stockout exposure, aging stock, supplier delay |
Outcome metrics alone arrive too late. Driver and risk metrics give teams time to respond.
Sales and Margin Metrics
Sales data should show more than total revenue. Retailers need enough detail to separate volume, price, mix, promotion, and store execution.
Useful metrics include:
- net sales;
- comparable-store sales;
- gross margin and gross margin rate;
- units per transaction;
- average transaction value;
- sales per square foot;
- transaction count;
- category and SKU contribution;
- markdown rate;
- discount depth;
- sales variance against plan and prior period.
Sales per square foot is useful for comparing physical locations, but it should not be used alone. Store format, rent, local demand, opening date, assortment, and fulfillment role can change what good performance looks like. Microsoft’s retail sample demonstrates this by comparing stores, districts, categories, current and prior periods, gross margin, variance, and new-store performance rather than relying on one KPI.
Inventory and Assortment Metrics
Inventory decisions affect revenue, margin, working capital, and customer trust. Retail BI should show both availability and the cost of carrying the wrong stock.
Useful metrics include:
- on-hand and available-to-promise inventory;
- on-shelf availability;
- stockout rate;
- lost-sales exposure;
- inventory turnover;
- days of supply;
- sell-through rate;
- weeks of cover;
- aged inventory;
- markdown exposure;
- replenishment lead time;
- forecast error;
- transfer and allocation performance.
A category with strong sales may still need attention if it repeatedly stocks out. A slow category may look weak because the assortment is wrong, because stores received too much inventory, or because product data and placement are poor. The dashboard should support diagnosis, not label every low result as low demand.
Store Operations and Labor Metrics
Store operations dashboards should connect customer demand with staffing and process performance.
Useful metrics include:
- labor cost as a percentage of sales;
- sales per labor hour;
- transactions per labor hour;
- schedule coverage against forecast demand;
- overtime;
- queue or checkout time;
- order-picking time;
- fulfillment backlog;
- task completion;
- opening and closing compliance;
- shrink and exception counts.
Labor efficiency should not reward understaffing. A lower labor ratio can coincide with longer queues, lower conversion, poor shelf availability, or more employee turnover. The dashboard needs a service or quality measure beside the cost measure.
Customer and Loyalty Metrics
Consumer data intelligence helps retailers connect purchase history, loyalty activity, campaign response, returns, service contacts, and channel behavior to understand repeat demand and the value of different customer groups.
Useful metrics include:
- new and returning customer revenue;
- repeat purchase rate;
- purchase frequency;
- customer lifetime value;
- retention and reactivation;
- loyalty enrollment and active membership;
- redemption rate;
- average basket by segment;
- category affinity;
- return rate by segment;
- campaign response;
- customer service contacts.
Retailers should define identity carefully. One person may purchase in store, online, through a marketplace, and under several email addresses. Customer-level analysis becomes unreliable when identity resolution and consent rules are unclear.
Omnichannel and Fulfillment Metrics
Retail BI should reflect how channels work together rather than treating stores and ecommerce as separate businesses.
Useful metrics include:
- revenue and margin by order origin and fulfillment method;
- buy online, pick up in store adoption;
- pickup readiness time;
- ship-from-store volume;
- cancellation and substitution rate;
- fulfillment cost per order;
- return-to-store rate;
- digital influence on store sales;
- inventory availability by channel;
- channel-level customer acquisition and retention.
A store may look less profitable if it absorbs pickup, return, or fulfillment work that is credited to ecommerce. Shared cost and revenue rules need to reflect the operating model, or channel dashboards will drive the wrong behavior.
Retail Decisions BI Should Improve
Business intelligence retail programs should be judged by the decisions they improve, not by the number of dashboards delivered.
Replenishment and Allocation
The decision is not simply how much inventory to buy. Retailers need to decide which location should receive each item, when to reorder, when to transfer stock, and when to stop replenishing.
A useful view combines sales velocity, current availability, days of supply, supplier lead time, open purchase orders, promotion calendars, local demand, and forecast uncertainty. Alerts should focus on exceptions that require action rather than list every low-stock item.
Pricing and Markdown Management
Pricing decisions need demand, margin, inventory age, competitor context, and promotion history. BI can show where markdowns move units but destroy margin, where full-price sell-through remains strong, and where aged stock needs intervention.
The system can calculate candidate products and expected scenarios. Merchandising and finance should retain ownership of pricing policy, brand constraints, and approval thresholds.
Promotion Analysis
A promotion should be evaluated against incremental sales and margin, not gross revenue during the event.
Useful analysis includes:
- baseline sales;
- incremental units;
- gross margin after discount;
- halo and cannibalization effects;
- redemptions;
- customer segment response;
- stock availability;
- post-promotion demand;
- supplier funding;
- store execution.
A promotion may appear successful because loyal customers shifted purchases forward or because discounted products replaced full-margin items. BI should make those tradeoffs visible.
Store Performance Management
Store rankings can be misleading when locations differ in format, size, maturity, local market, assortment, and fulfillment role.
A better view compares each store with an appropriate peer group and shows:
- sales and margin variance;
- traffic and conversion;
- availability;
- labor productivity;
- returns;
- shrink;
- service performance;
- local promotion response;
- new-store ramp.
The owner should be able to move from portfolio view to district, store, department, category, and SKU without changing metric definitions.
Workforce Planning
Store labor decisions need demand forecasts at the level where schedules are built. Monthly sales totals are too broad for hourly coverage.
A useful planning view combines historical transactions, traffic, local events, promotions, deliveries, fulfillment workload, and required roles. Managers should still review constraints such as employee availability, labor rules, training, and service standards.
Customer Retention and Personalization
Customer analytics can identify groups with declining purchase frequency, category changes, repeated service problems, or low promotion response.
The action may be a campaign, service recovery, loyalty offer, or audience exclusion. The model should show why the customer entered the segment and which consent rules apply. Personalization is only useful when the data is accurate and the offer fits the customer context.
Store Expansion, Remodeling, and Closure
Long-term location decisions need more than store sales. Retailers may combine profitability, traffic, customer origin, lease cost, local competition, demographic data, ecommerce demand, fulfillment value, and capital requirements.
Tableau’s retail guidance highlights the use of product sales, inventory, department performance, and third-party demographic data for store-level analysis. External data should add context, but internal store economics and operating constraints still need to drive the decision.
Dashboards by Retail Role
One dashboard should not serve every role.
| Role | Primary Questions | Recommended View |
|---|---|---|
| Executive | Are growth, margin, cash, and strategic initiatives on plan? | Portfolio scorecard with drill-down |
| Regional leader | Which stores need intervention and why? | District and peer comparison |
| Store manager | What needs action today? | Daily operations and exception queue |
| Merchandiser | Which categories, products, and promotions need adjustment? | Assortment, pricing, margin, inventory |
| Supply chain | Where will availability or capacity fail? | Forecast, replenishment, supplier, network risk |
| Marketing | Which campaigns create incremental value and repeat demand? | Customer, promotion, attribution, retention |
| Finance | Which stores and channels create profitable growth? | Margin, cost, budget, working capital |
| Ecommerce | Where does the online journey or fulfillment process break? | Conversion, order, inventory, fulfillment |
| Customer service | Which issues point to product or operating problems? | Contact reasons, resolution, store and SKU trends |
The store manager’s first screen should favor today’s exceptions. The executive dashboard should favor trend, target, variance, and risk. Detail can live in linked reports.
Business Analytics and Business Intelligence Solutions in Retail
Business intelligence and business analytics overlap, but they serve different parts of the decision cycle.
BI usually focuses on governed reporting, monitoring, exploration, and alerts. Business analytics adds statistical analysis, forecasting, optimization, and predictive models. Business analytics and business intelligence solutions in retail work best as one system: BI establishes trusted metrics and operational visibility, while analytics estimates what may happen and compares possible actions.
| Capability | Main Question | Retail Example |
|---|---|---|
| Descriptive BI | What happened? | Sales and margin by store |
| Diagnostic analytics | Why did it happen? | Sales decline linked to availability |
| Predictive analytics | What may happen next? | Demand or churn forecast |
| Prescriptive analytics | What action is preferred? | Replenishment or markdown recommendation |
| Workflow automation | How does the action reach the owner? | Task, alert, approval, or system update |
Do not jump to predictive models before the descriptive layer is trusted. A forecast built on inconsistent product, store, promotion, or inventory definitions will add complexity without improving the decision.
The Architecture Behind Retail BI
Strong data engineering provides the pipelines, transformations, quality controls, and shared data models behind a retail BI platform. The architecture usually contains six layers:
- Source systems: POS, ERP, ecommerce, CRM, loyalty, workforce, marketing, service, and store systems.
- Ingestion: batch connectors, APIs, change data capture, event streams, or managed integration tools.
- Storage and transformation: a warehouse, lakehouse, or other analytics platform with tested data models.
- Semantic and metrics layer: shared definitions for stores, products, customers, sales, inventory, margin, and time.
- Consumption: dashboards, reports, alerts, embedded analytics, and governed self-service access.
- Decision workflow: tasks, approvals, planning tools, and operational systems where teams act.
AWS positions a shared retail data layer as a foundation for dashboards, complex calculations, conversational analytics, machine learning, and AI. The correct stack depends on data volume, latency, existing platforms, team skills, security requirements, and cost.
A retailer does not need every fashionable component. The architecture is successful when data arrives within the decision window, metrics remain consistent, failures are visible, and users can act without rebuilding the analysis in spreadsheets.
Data Quality and Governance
Retail data changes constantly. Products are renamed. Stores move between regions. Promotions overlap. Returns post after the original sale. Customer identities merge. Suppliers change lead times. If the system does not manage these changes, dashboard trust declines.
Governance should define:
- the source of truth for each domain;
- product, store, channel, and customer hierarchies;
- net sales and gross margin calculations;
- promotion and markdown rules;
- return and cancellation treatment;
- data refresh and backfill behavior;
- data owners and stewards;
- access by role, store, region, and function;
- quality tests and incident response;
- metric versioning and change approval;
- retention, consent, and privacy requirements.
Data quality checks should cover freshness, volume, duplicates, missing keys, referential integrity, unexpected values, and reconciliation against source totals.
A dashboard should show when its data was last refreshed. If a metric is estimated, modeled, or incomplete, the interface should say so.
How AI Fits Into Retail Business Intelligence
AI can make retail analytics easier to use, but it does not replace the data model or metric governance. A connected Data and AI approach combines governed retail data, analytics, forecasting, AI-assisted explanations, and decision workflows.
Useful AI applications include:
- natural-language questions over governed retail data;
- written summaries of material performance changes;
- demand forecasting;
- anomaly detection;
- customer and product segmentation;
- review and support-ticket analysis;
- replenishment or markdown recommendations;
- root-cause candidate generation;
- dashboard discovery and metadata search.
AI-generated explanations should link back to the underlying measures, stores, products, time periods, and source records. A summary that says “inventory caused the decline” is not enough. The user needs to see the availability metric, affected SKUs, timing, and confidence.
High-impact actions such as purchase orders, price changes, workforce reductions, and customer-level offers should use approval rules and monitored limits. The model can prepare the recommendation. The responsible manager owns the decision.
A Practical Retail BI Implementation Plan
- Pick one decision. Start with a decision such as replenishment, daily store performance, promotion evaluation, or labor planning.
- Define the owner and action. State who will use the result, how often, and which decision they can make.
- Establish metric definitions. Agree on sales, margin, availability, time, channel, and hierarchy logic before designing visuals.
- Connect the minimum sources. Build only the data flow required for the first decision.
- Create a reconciled model. Test totals against POS, ERP, finance, or other source reports.
- Design the decision view. Show the outcome, drivers, target, variance, risk, and next action.
- Add exception delivery. Use alerts or tasks for conditions that need attention before the next dashboard review.
- Pilot with one region or team. Observe how users interpret the metrics and what actions follow.
- Measure adoption and decision impact. Track usage, action rate, cycle time, forecast error, availability, margin, or another relevant result.
- Expand reusable foundations. Add stores, categories, sources, and predictive models after the core definitions and workflow remain stable.
This sequence limits the risk of building a large data platform before the business proves how it will use the output.
When Retail BI Is Not Ready to Scale
A retailer may need to fix its operating data before expanding BI.
Warning signs include:
- stores use different product or transaction definitions;
- financial and POS sales do not reconcile;
- inventory updates arrive after the decision window;
- store and product hierarchies change without history;
- no owner can approve metric definitions;
- dashboards have users but no documented decisions;
- analysts spend most of their time correcting extracts;
- alerts have no recipient or response process;
- predictive outputs cannot be compared with a baseline;
- sensitive customer or employee data lacks clear access rules.
The correct response is not another visualization tool. It is a narrower scope, better source integration, or stronger governance.
How to Measure a Retail BI Program
A BI program needs platform metrics and business metrics.
| Measurement Area | Example Metrics |
|---|---|
| Data reliability | Refresh success, reconciliation variance, failed tests, incident recovery time |
| Adoption | Active users, repeat usage, report abandonment, self-service queries |
| Decision execution | Alerts acted on, time to action, completed interventions |
| Inventory | Stockout rate, availability, turns, aged stock, forecast error |
| Store operations | Sales per labor hour, queue time, task completion, fulfillment backlog |
| Commercial performance | Margin, promotion incrementality, sell-through, comparable-store sales |
| Customer | Repeat rate, retention, service contacts, campaign response |
| Delivery efficiency | Time to create a metric, report, or new store view |
Do not claim BI caused a revenue increase simply because both changed after launch. Track the decision mechanism. If a replenishment dashboard reduced the time to identify stock risk and improved availability in the pilot stores, that is a stronger result than a broad correlation.
FAQ
What Is Retail Business Intelligence?
Retail business intelligence combines data from POS, inventory, ecommerce, customer, workforce, finance, and other systems to support store and enterprise decisions. It uses shared metrics, dashboards, reports, alerts, and analysis tools to show performance, explain changes, and guide action.
What Data Is Used in Retail BI?
Common sources include transactions, stock levels, purchase orders, returns, prices, promotions, loyalty activity, online orders, website behavior, schedules, labor hours, support records, supplier data, and financial results. The required sources depend on the decision the retailer wants to improve.
Which KPIs Matter Most for Retail Stores?
Core KPIs often include net sales, gross margin, transaction count, average transaction value, units per transaction, sales per square foot, conversion, availability, stockouts, inventory turns, sell-through, returns, labor productivity, and customer retention. The right mix depends on the store format and user role.
What Is the Difference Between Retail BI and Retail Analytics?
Retail BI usually focuses on trusted reporting, monitoring, dashboards, and alerts. Retail analytics extends that foundation with diagnostic, predictive, and prescriptive methods. BI may show that availability declined. Analytics may forecast the risk and recommend an allocation change.
Does Retail Business Intelligence Need Real-Time Data?
Only decisions with a short response window need low-latency data. Checkout issues, fraud, queue conditions, and inventory availability may require frequent updates. Monthly portfolio reviews do not. Refresh frequency should match the time available to act.
Can Small Retailers Use Business Intelligence?
Yes. A smaller retailer can start with POS, inventory, ecommerce, and finance data in a focused dashboard. The first goal should be one repeatable decision, such as replenishment or weekly category review, rather than a large enterprise platform.
How Do You Choose a Retail BI Tool?
Start with data sources, user roles, required refresh frequency, deployment model, governance, embedded analytics, self-service needs, scalability, and total operating cost. Tool selection should follow the decision model and architecture, not lead them.
Final Thoughts
Retail business intelligence earns its place when store data changes a decision. The strongest programs connect commercial outcomes with the drivers behind them: availability, conversion, labor, pricing, assortment, promotion, fulfillment, and customer behavior.
Start with one decision and one accountable owner. Define the metric before designing the dashboard. Connect the minimum data needed. Add alerts when the response window is short. Introduce forecasting and AI after the descriptive layer is trusted.
We help retailers build that foundation through retail analytics and business intelligence, data engineering, platform integration, and decision-focused dashboards. WiserBrand’s retail software development services cover store, inventory, POS, ecommerce, and analytics workflows, while our BI consulting practice supports strategy, implementation, visualization, governance, and adoption.