Using Data to Make Decisions: How to Turn Operational Data Into Action


Using data to make decisions should not mean waiting for a monthly report and hoping the numbers explain themselves. Operational data is most useful when it shows what is happening now, which part of the business it affects, and what action should follow.
Every company already produces this data. Sales creates pipeline records. Support creates tickets. Finance creates invoices and payment history. Operations creates delivery, capacity, and exception records. Marketing creates campaign and lead data. It usually stays trapped in the systems that generated it.
The gap between having data and using it is the step where a number becomes a signal. A manager who sees that ticket volume rose has learned almost nothing. A manager who sees which category rose, which customers are affected, how the backlog changed, and which agent owns the response can act before the SLA breaks.
IBM defines data-driven decision-making as an approach that uses data and analysis rather than intuition to inform business decisions. The operational version of that idea is narrower and more demanding: the data has to reach a specific person, inside their working cycle, with enough context to justify a specific action.
This guide covers what operational data is, why it so often fails to change decisions, how to turn metrics into signals with thresholds and owners, how to build a repeatable data-to-decision workflow, and where automation and AI genuinely help.
What Is Operational Data?
Operational data is the record of daily business activity. It describes how the business runs rather than how it performed at the close of the month.
Examples include:
- Orders created, fulfilled, delayed, or returned.
- Leads captured, qualified, assigned, and closed.
- Tickets opened, escalated, resolved, or reopened.
- Invoices issued, approved, paid, or overdue.
- Employees onboarded, assigned, scheduled, or trained.
- Inventory received, reserved, sold, or out of stock.
- Campaigns launched, clicked, converted, or ignored.
Its value comes from proximity to the work. Financial results confirm that a target was missed. Operational data usually shows the reason while it is still fixable: response times slipped, conversion fell in one segment, fulfillment slowed at one carrier, approvals queued behind one person.
Why Operational Data Often Fails to Drive Decisions
Most companies collect more data than they use. The shortage is rarely dashboards.
| Problem | What Happens |
|---|---|
| Data is scattered | Teams read different systems and argue about the source of truth instead of the decision. |
| Metrics lack context | A number changes and nobody can say if it falls outside normal variation. |
| Reports arrive too late | Teams see the issue after the decision window has closed. |
| Ownership is unclear | The dashboard shows a problem that belongs to nobody. |
| Data quality is weak | People stop trusting the numbers and fall back on instinct. |
Each of these breaks the same link. Reporting tells people what happened; decisions need a connection between the data, a threshold, a named owner, and a defined action.
A view of open tickets changes nothing until the team knows the target, the trend, the likely cause, the risk, and who responds. A pipeline value changes nothing until it tells a leader where to coach, where to move effort, or which forecast number to challenge.
Start With the Decision, Not the Data
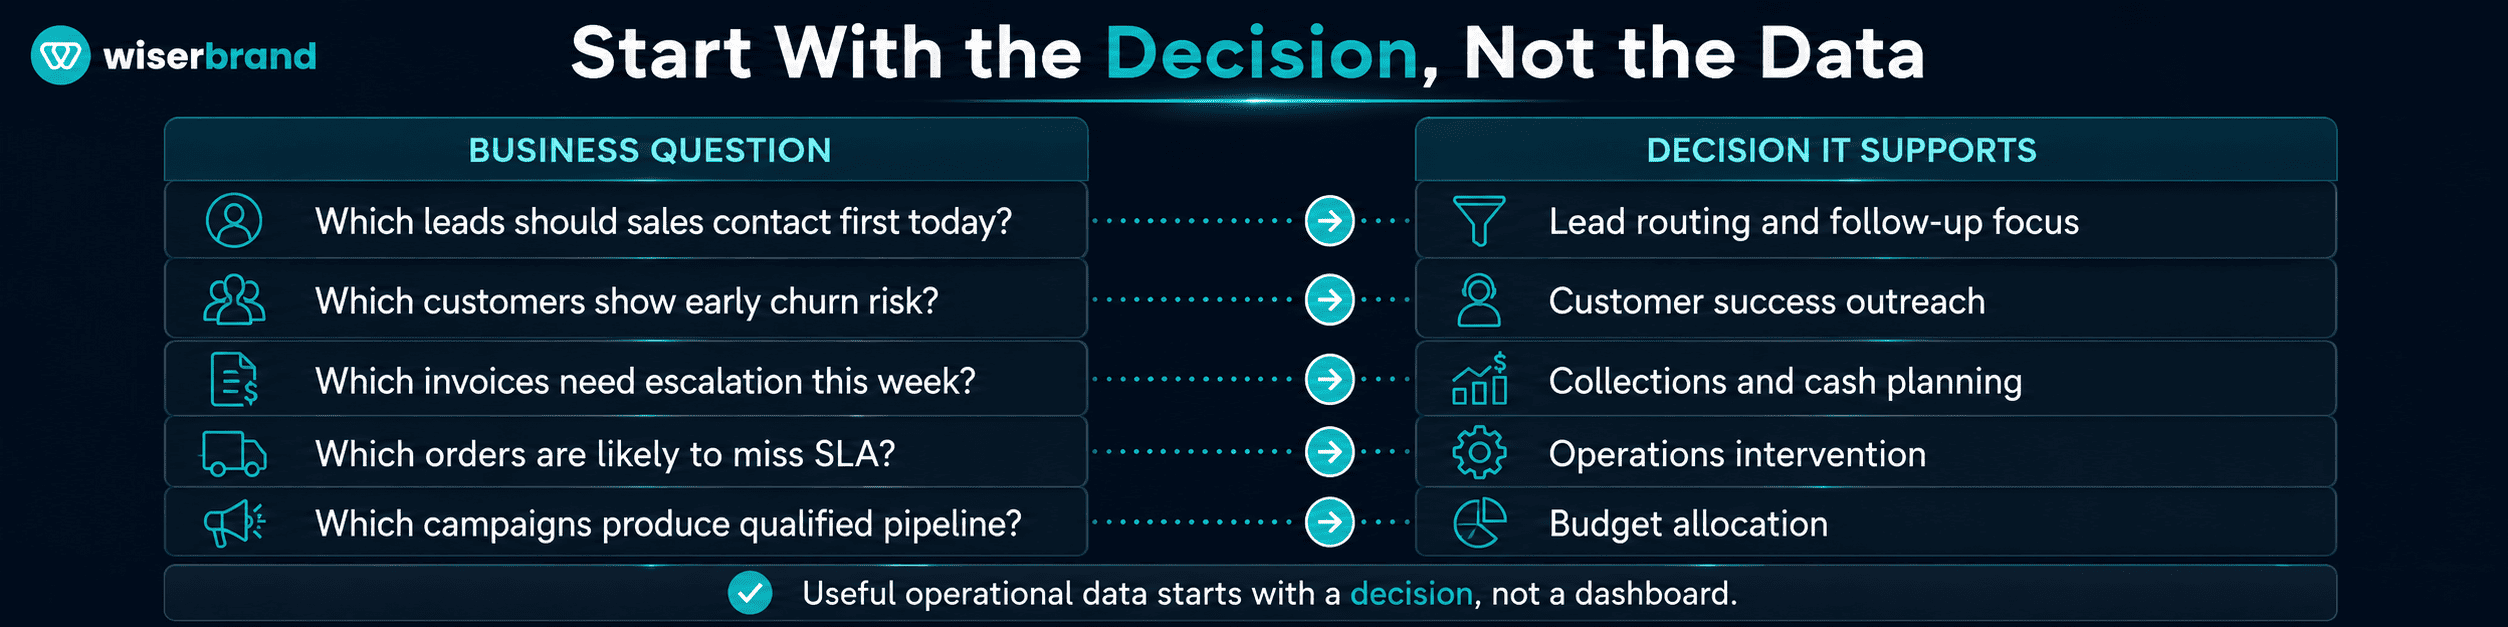
Teams that start from available data end up with crowded dashboards. Teams that start from a decision end up with a short list of metrics that earn their place.
A practical data strategy starts with the decision the business needs to improve, then works backward to the required metrics, sources, owners, and actions.
| Business Question | Decision It Supports |
|---|---|
| Which leads should sales contact first today? | Lead routing and follow-up focus. |
| Which customers show early churn risk? | Customer success outreach. |
| Which invoices need escalation this week? | Collections and cash planning. |
| Which products drive returns? | Merchandising and quality review. |
| Which orders are likely to miss SLA? | Operations intervention. |
| Which campaigns produce qualified pipeline? | Budget allocation. |
| Which support categories are rising? | Product or process fixes. |
The aim is not complete knowledge. It is enough context to make the next decision better than the last one.
Turn Metrics Into Decision Signals
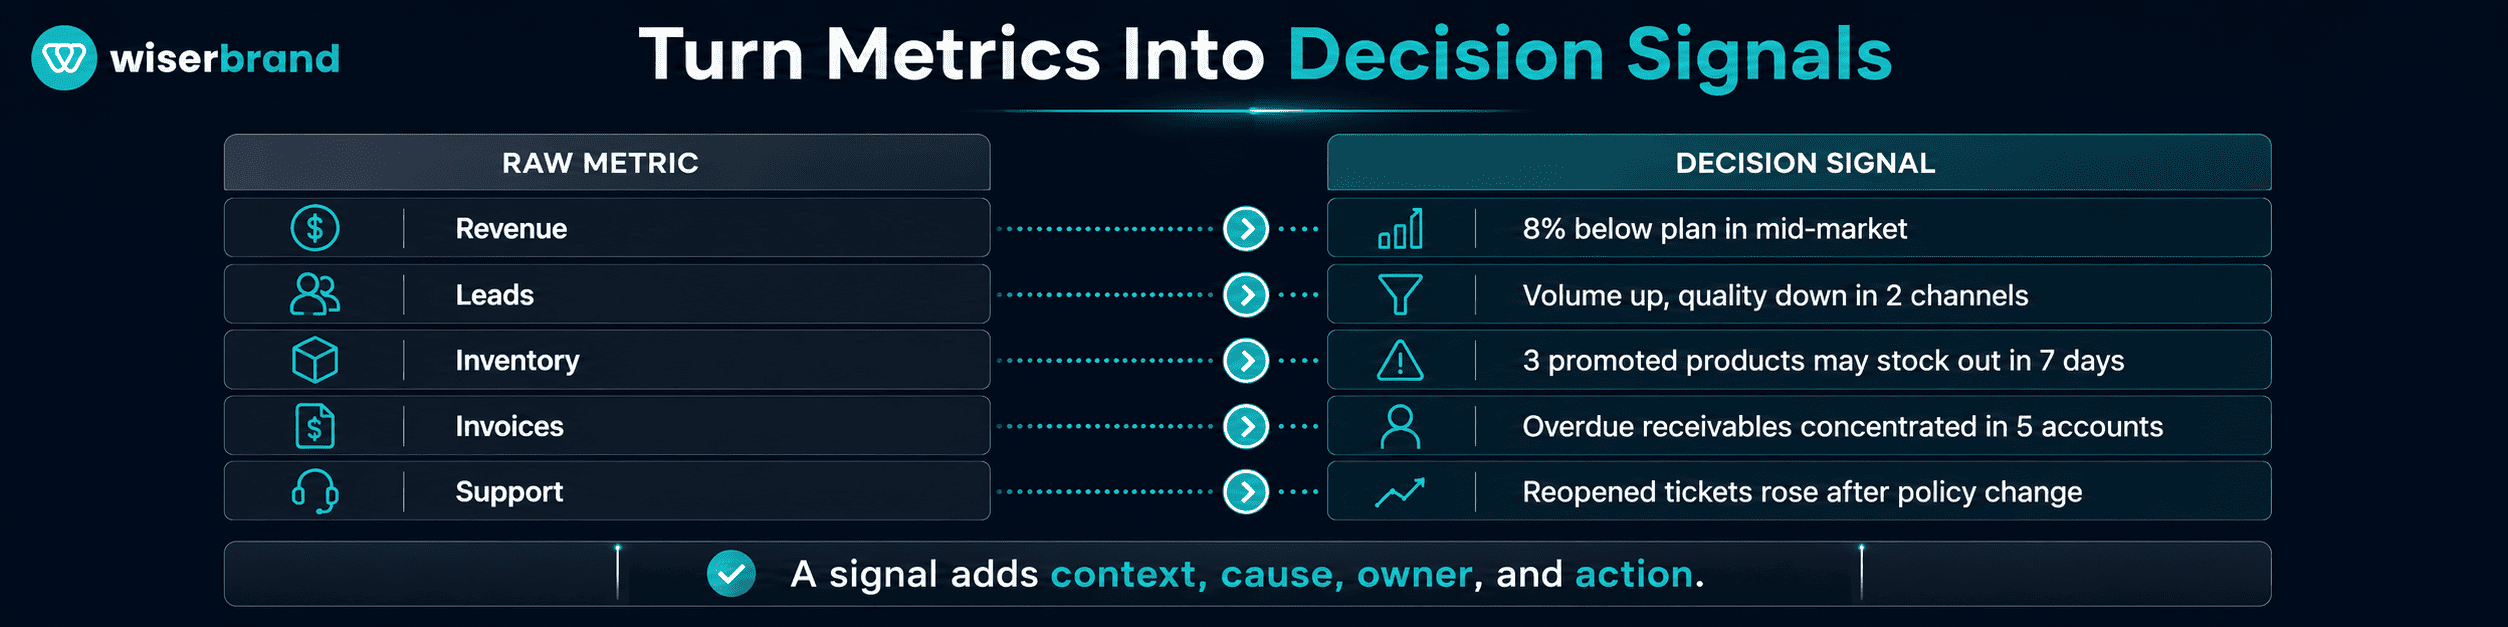
A metric is a number. A decision signal is a number with a comparison, a likely cause, an owner, and a next action.
The difference is visible in a single case:
- Metric: 340 open tickets.
- Signal: priority tickets rose 28% week over week, concentrated in > one product category, with 41 approaching SLA breach.
- Action: the support lead assigns two agents to that category, pauses > non-urgent work, and notifies the product owner.
The numbers above are illustrative rather than measured, but the shape holds across functions.
| Raw Metric | Decision Signal |
|---|---|
| Revenue | Revenue is 8% below plan because average deal size fell in mid-market accounts. |
| Leads | Lead volume rose while lead-to-opportunity rate fell in two paid channels. |
| Inventory | Three promoted products are projected to stock out within seven days. |
| Invoices | Overdue receivables are concentrated in five enterprise accounts. |
| Support | Reopened tickets rose after a policy change took effect. |
| Operations | Cycle time increased in one approval step, not across the process. |
Four components make a signal actionable: the current value, a comparison point, the segment or cause, and the recommended action. Drop any one of them and the reader has to do the analysis before deciding, which is usually where the process stalls.
How to Set Thresholds People Will Act On
Thresholds convert monitoring into response, and most teams set them by intuition and then ignore the resulting alerts.
Start from the historical distribution. Pull twelve months of the metric, look at its normal weekly variation, and set the concerning level outside that range rather than at a round number. A support queue that swings 20% week to week should not alert at 10%.
Weigh the two error costs explicitly. A missed stockout on a promoted product costs more than a false alarm, so that threshold should sit early and tolerate noise. A collections escalation that annoys a strategic account carries a real cost, so it should fire later and with tighter criteria.
Define the response before switching the alert on. Each threshold needs an owner, a response window, and an action that owner can actually take with the access they have. An alert routed to a group inbox with no named owner produces no response.
Then review the alerts that fired. If a threshold triggers weekly and nobody acts, either the level is wrong or the action was never possible. Alert fatigue is a design failure rather than a discipline problem.
Build a Data-to-Decision Workflow
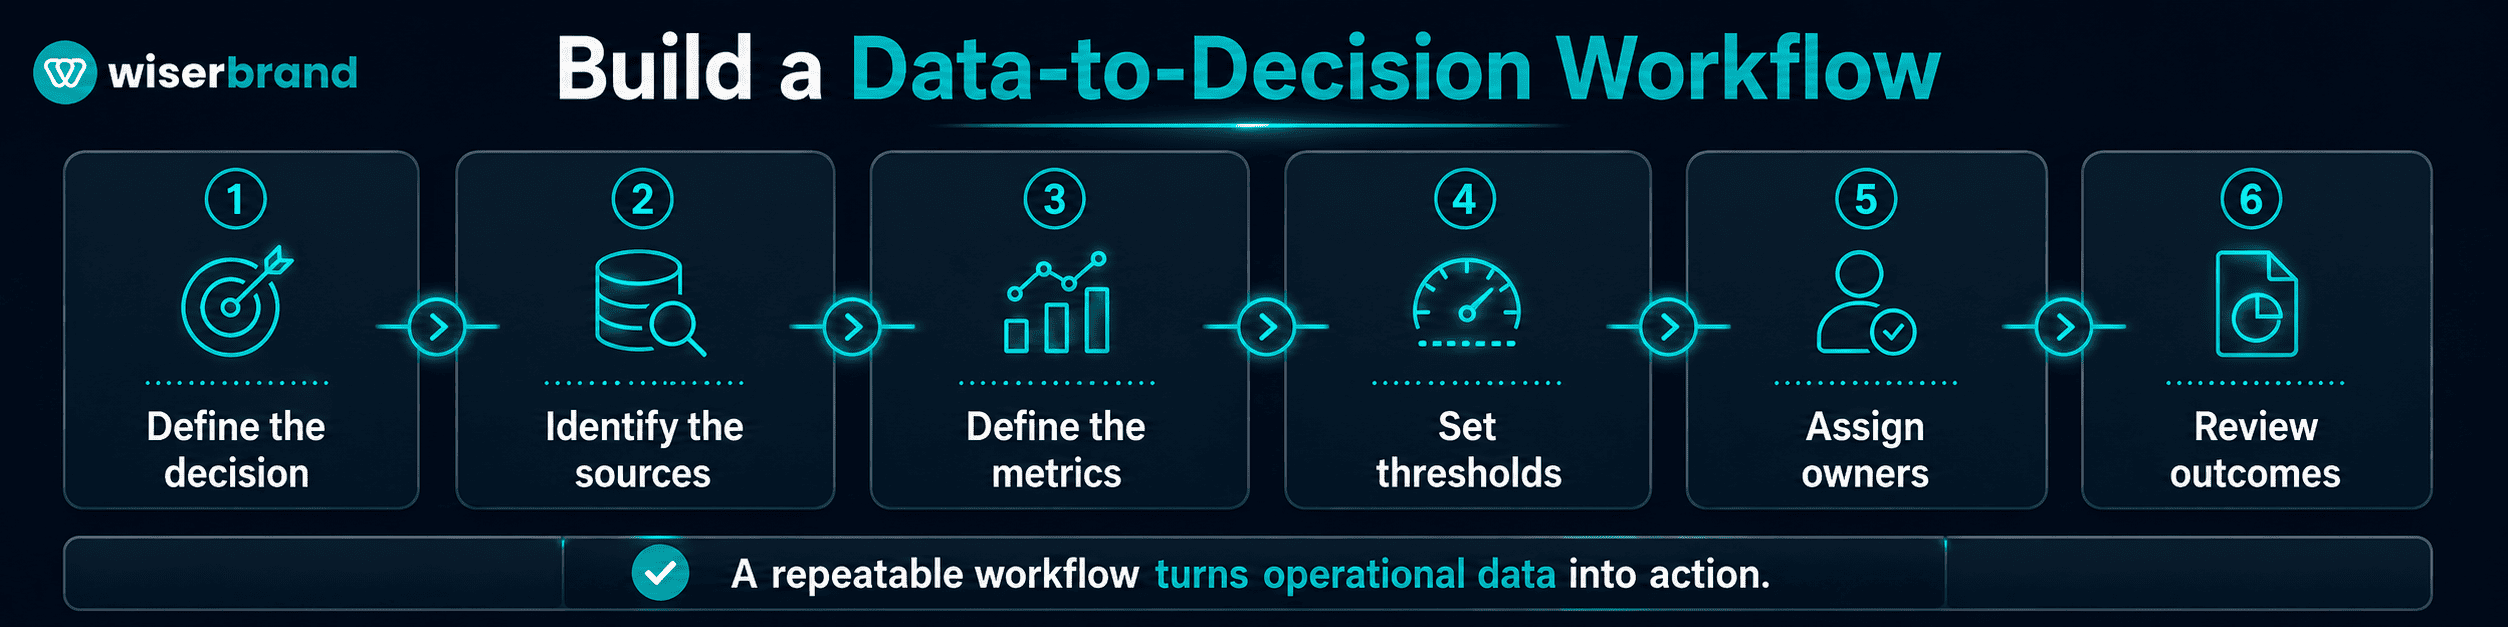
Operational data creates value once it becomes part of how a team works. Using data to make decisions consistently takes a repeatable sequence rather than a one-off build.
- Define the decision. Name the business decision the data should > improve and the person who makes it.
- Identify the sources. List the systems holding the records, and > designate one as the source of truth for each field.
- Define the metrics. Choose the few that explain performance, cause, > and risk, and write down how each is calculated.
- Set thresholds. Decide what counts as normal, concerning, and > urgent, using the historical distribution.
- Assign owners. Every signal needs a named person and a response > window.
- Choose the delivery. A dashboard suits recurring review; an alert or > a work queue suits anything that needs a response within hours.
- Define the action rules. State what happens when each threshold is > crossed, including who is notified and what they can change.
- Handle the exceptions. Decide in advance what happens when data is > missing, a source is stale, or an integration fails.
- Review outcomes. Compare the decision quality and speed against the > baseline you recorded before launch.
- Adjust. Retire metrics nobody uses and recalibrate thresholds that > generate noise.
Step nine is the one teams skip, and it is the one that separates a reporting project from a decision system. Record the baseline before the change, or there is nothing to compare against later.
Operational Data by Business Function
The same data becomes useful at different moments for different teams. What follows is the decision each function is trying to improve and the signals that fire early enough to matter. For the full metric sets and dashboard layouts by function, see our guide to business intelligence dashboards.
Sales
Sales decisions are about where to spend the next hour of rep and manager attention. The signals that support them are lead response time, stage aging beyond the normal range for that stage, opportunities with no scheduled next step, and forecast category movement late in the quarter. All four are visible while the deal is still winnable.
Marketing
Marketing decisions are about where the next increment of budget goes. Cost per qualified opportunity by channel, lead-to-opportunity rate by source, and payback period carry that decision. Channel volume metrics explain movements in those numbers without driving the decision themselves.
Finance
Finance decisions concern cash timing and spending authority. Receivable aging concentration, invoice approval cycle time, budget variance above a defined threshold, and payment delay patterns by customer all give warning ahead of the reported result. A late invoice is rarely only a finance issue, so route the signal to account management as well.
Operations
Operations decisions are about where to add capacity and what to fix first. Cycle time by stage, backlog age, exception rate by type, and SLA risk by segment identify the constraint. A rising backlog on its own does not; the actionable version names the step and the reason.
Customer Support
Support decisions are about staffing today and escalation this week. Backlog by priority and age, first response time against SLA, reopened tickets, and escalation reasons cover both. Read the speed and quality signals together, since a faster queue with more reopens has not improved.
Use Automation to Move Work Forward
Business process automation earns its place when an operational signal should assign work, create a task, route an exception, or notify an owner rather than remain on a dashboard. The design question is which system holds the trigger, which system performs the action, and what the action is not allowed to do.
| Signal and Source | Automated Action | Control |
|---|---|---|
| Lead matches fit criteria in the CRM | Assign an owner and create a follow-up task | Round-robin rules; no changes to the account record |
| Invoice passes due date in the finance system | Notify the account owner and finance lead | Read-only on payment status; no dunning email sent automatically |
| Stock falls below threshold in the inventory system | Alert purchasing and merchandising | Alert only; no purchase order raised without approval |
| Ticket approaches SLA in the help desk | Escalate to the team lead and reprioritize the queue | Priority change logged with a reason |
| Usage drops below baseline in the product database | Create a customer success task | Task only; no customer message sent automatically |
| Order marked delayed in the ERP | Create an operations exception case | Customer notification uses an approved template |
Failure handling belongs in the same design. Decide what happens when the source system is unavailable, when the same event arrives twice, and when nobody responds inside the window. Deduplication keys, a retry limit, and an escalation path after a defined interval prevent both silent gaps and duplicate action.
Keep the risky actions behind a person. Assigning, notifying, drafting, flagging, and preparing a recommendation are safe to automate. Releasing payment, issuing refunds above a threshold, changing account access, sending contractual commitments, and anything touching employee records should require explicit approval, with the approval recorded.
Where AI Helps and Where It Does Not
AI is useful in this workflow where the input is messy, unstructured, or too large to read manually. Its output is an interpretation, not an executed action.
The reliable applications:
- Classifying tickets, emails, and cases into the categories your routing rules already use.
- Extracting structured fields from invoices, contracts, and forms so they can be validated by ordinary rules.
- Summarizing calls, threads, and case histories for a human who has to decide something.
- Drafting responses and internal updates for review.
- Explaining a change by summarizing the segments and records behind it, once the calculation has identified the movement.
Two distinctions matter for anyone designing this. Anomaly detection is usually a statistical job; a model is helpful for describing the anomaly in plain language, not for deciding what counts as one. And a model that recommends an action has not performed it. Between the recommendation and the change to a customer record sit validation, permissions, and in most cases a human approval.
The strongest use is combining structured and unstructured evidence. Usage data shows a customer’s activity falling; support notes explain an unresolved complaint behind it. Together they form a churn signal that neither source supports alone.
McKinsey’s research on data-driven enterprises describes a related shift: away from engineers repeatedly curating data for each new use case, toward reusable data products that reduce engineering effort and shorten time to value. The same logic applies at a smaller scale. If every AI use case needs its own extraction pipeline, the cost compounds.
Clean data matters more with AI in the loop, not less, because a model will produce a confident, well-written recommendation from bad inputs.
Data Quality and Governance
Using data to make decisions depends on trust. Teams that do not trust the numbers either ignore them or relitigate them in every meeting.
Gartner’s data governance guidance covers ownership and accountability, policies for quality, security, privacy, and retention, and the definitions behind analytics artifacts. For operational decisions, that translates into a short list of questions each metric should answer:
- Which system is the source of truth?
- Who owns the metric?
- How is it calculated?
- How often does it refresh, and how is staleness visible?
- What quality checks run, and what happens when one fails?
- Who can change the definition, and how is the change recorded?
- What happens when records are missing or conflicting?
- Which roles can see sensitive fields?
Governance at this level reduces argument rather than adding process. Shared definitions and a known source remove the most common reason decisions stall.
Common Mistakes to Avoid
The frequent mistake is treating data as proof rather than input. Data improves judgment; it does not replace the person accountable for the call.
- Building the dashboard before defining the decision.
- Tracking metrics nobody owns.
- Confusing activity with progress.
- Reporting outcomes without drivers.
- Setting thresholds that produce alerts nobody acts on.
- Using stale data for fast-moving decisions.
- Automating actions without approval boundaries or failure handling.
- Treating model output as verified fact.
- Keeping reports nobody opens.
A strong data culture is not one where every decision has a chart behind it. It is one where people know which numbers matter, trust the source, understand the limits, and act inside a defined window.
How to Measure Better Decision-Making
Treat this like any other operational improvement, which means recording the baseline before the change and defining the measurement period.
| Decision Area | Improvement Metric | Requires |
|---|---|---|
| Sales prioritization | Lead response time, conversion rate, stale deal count | A baseline from the prior quarter, segmented by channel |
| Support management | Backlog age, resolution time, reopen rate | Consistent category definitions across periods |
| Finance control | Approval cycle time, overdue receivables, forecast accuracy | Aging measured on the same day of each month |
| Operations | Cycle time, SLA breaches, exception rate | Exception types defined before the comparison |
| Marketing | Cost per qualified opportunity, pipeline contribution | A fixed attribution model and lookback window |
| Customer success | Time to intervention, retention in the at-risk cohort | A documented risk definition |
Two cautions apply to every row. A change that follows a deployment is not proof the deployment caused it, so record what else changed in the period. And time saved is not money saved until someone decides what the released capacity does instead.
The practical test is behavioral. If a dashboard, alert, or model output does not change what someone does, it has not yet earned its maintenance cost.
FAQ
What Does Using Data to Make Decisions Mean?
Using data to make decisions means guiding business choices with operational, financial, and customer data instead of relying on intuition alone. In practice it requires a defined decision, an agreed metric, a threshold, an owner, and a response window.
What Is Operational Data?
Operational data is the record of daily business activity: orders, tickets, invoices, leads, inventory movements, campaign results, and workflow events. It sits closer to the work than financial reporting, which is why it shows causes earlier.
How Do You Turn Data Into Business Decisions?
Start with one decision, choose the few metrics that explain it, define thresholds from historical variation, assign an owner, deliver the signal where the work happens, and define what action each threshold triggers.
How Do You Set a Threshold?
Use the metric’s normal variation over a long enough history, then adjust for the cost of a missed issue against the cost of a false alarm. Confirm the owner can take the required action before the alert goes live.
Why Do Companies Struggle With Data-Driven Decisions?
Data sits in separate systems, definitions differ between teams, reports arrive after the decision window, dashboards carry too many metrics, or nobody owns the response.
Can AI Help With Operational Decision-Making?
AI classifies, extracts, summarizes, drafts, and explains, which covers a large share of the manual reading in operational work. It produces recommendations rather than executed actions, so validation, permissions, and human approval still sit between the output and any change to a customer, payment, or employee record.
What Is the First Step?
Pick one decision that a team makes repeatedly and gets wrong or late. Map the data behind it, set one threshold, and assign one owner. That is more useful than redesigning every dashboard at once.
Final Thoughts
Using data to make decisions is a workflow problem before it is a tooling problem. The decision rule: a metric belongs in the system when a named person will act differently depending on its value, inside a window where the action still changes the outcome.
The usual constraint is not analytics capability. It is unagreed definitions and unassigned ownership, and neither is solved by another dashboard.
Start with one decision your team makes weekly. Write the metric definition, set the threshold from real variation, name the owner, decide where the signal appears, and record the baseline so the result is measurable later.
If your team has dashboards but still makes decisions through scattered spreadsheets, status calls, and instinct, our Data and AI team can connect KPI definitions, reporting logic, thresholds, workflow automation, and AI-assisted analysis into a practical decision system.