AI Adoption in 2026: Statistics, Trends, and Market Growth


Current US AI adoption estimates range from about 18 percent of firms to about 78 percent on an employment-weighted basis because public surveys measure different units and definitions. The April 2026 Federal Reserve Board comparison of public surveys makes that distinction explicit: firm-weighted, employment-weighted, and worker surveys answer different questions. This article compares current federal and industry data, breaks adoption down by firm size and industry, separates usage from spending, and gives business readers a method for interpreting AI adoption statistics without treating any single percentage as a universal rate.
The Headline Numbers Side by Side
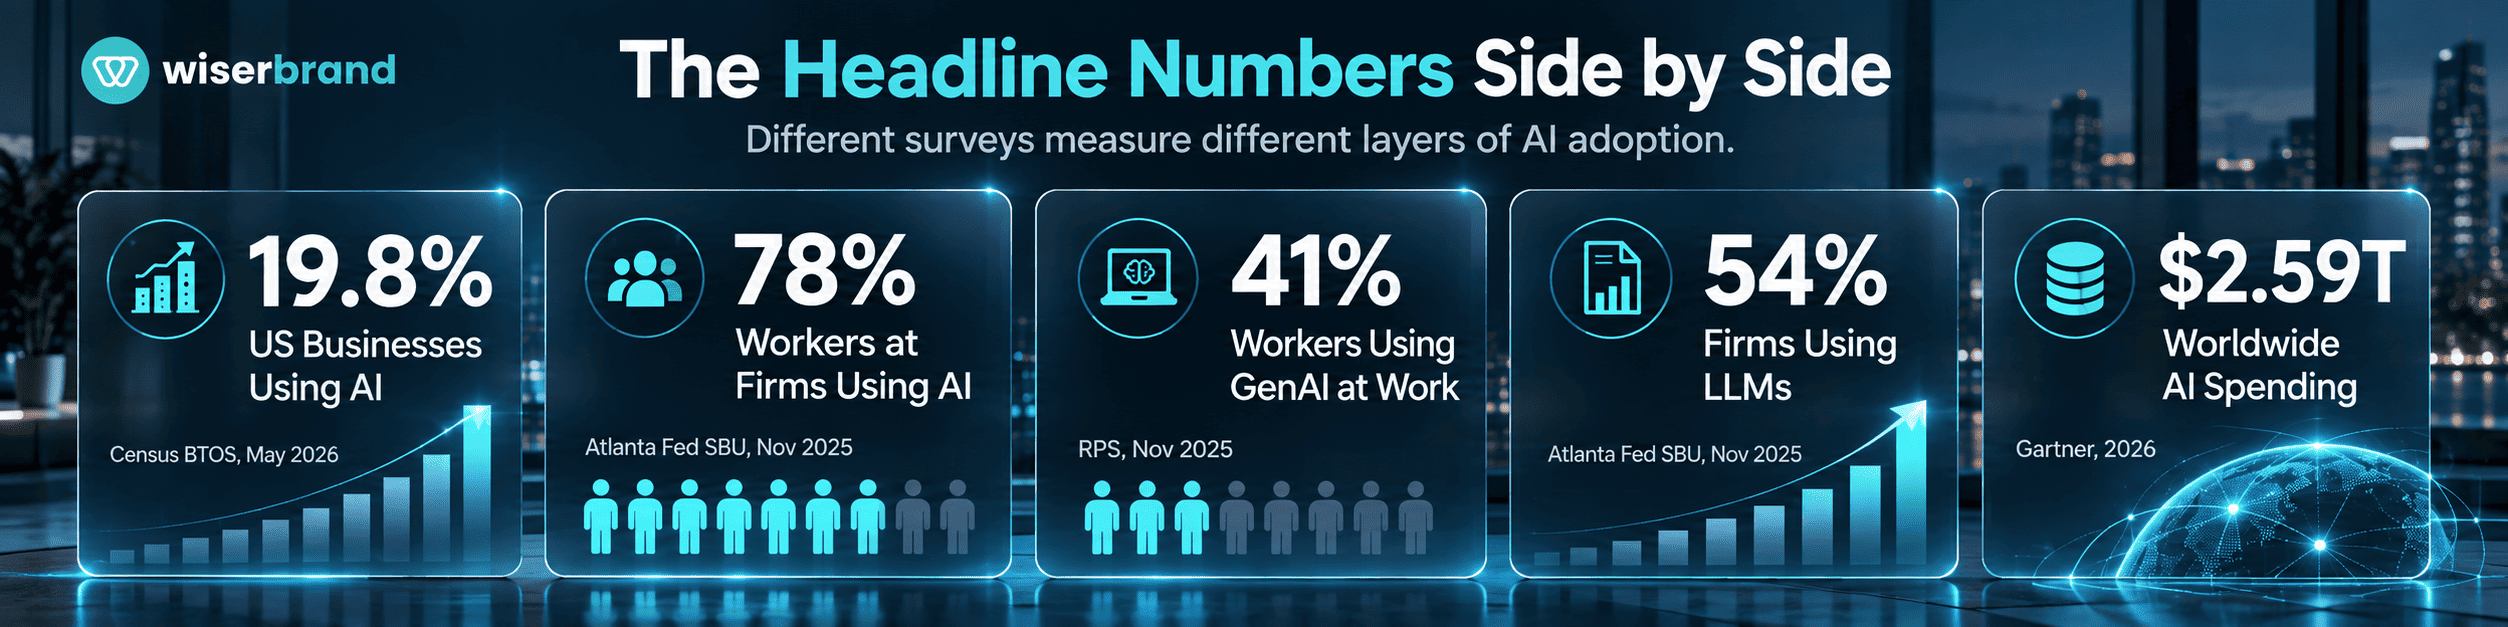
A Federal Reserve Board FEDS Note published on April 3, 2026 compared three public surveys with different target respondents. The table below adds the more recent Census reading published after that note.
| Measure | Source | Date | What it counts | Estimate |
|---|---|---|---|---|
| Firms using AI | Census Bureau BTOS | December 2025 | Firm-weighted share of US businesses | About 18% |
| Firms using AI | Census Bureau BTOS | May 2026 | Firm-weighted share of US businesses | 19.8% |
| Firms using AI | Atlanta Fed SBU | November 2025 | Employment-weighted share | About 78% |
| Workers using generative AI at work | Real-Time Population Survey | November 2025 | Share of the labor force | About 41% |
| Firms using LLMs | Atlanta Fed SBU | November 2025 | Employment-weighted share | About 54% |
| Adults using generative AI outside work | Real-Time Population Survey | November 2025 | Share of the population | About 50% |
The April 2026 Federal Reserve Board FEDS Note explains which question each survey answers. The Business Trends and Outlook Survey (BTOS) estimates the share of US businesses using AI. The Real-Time Population Survey (RPS) estimates the share of the labor force using generative AI at work. The Survey of Business Uncertainty (SBU) uses employment weighting to estimate the share of workers employed by firms that report AI adoption. For organizations turning these benchmarks into an AI adoption plan, the figures should provide context for priorities and baselines, not a target that every company should copy.
Why the Estimates Disagree by 60 Points
The April 2026 Federal Reserve Board FEDS Note identifies four main sources of variation in reported adoption of AI: sampling and unit of analysis, question framing and materiality, information asymmetry, and possible social desirability bias.
Unit of analysis and sampling come first. About 95 percent of US firms have fewer than 50 employees, but firms with 250 or more employ roughly 56 percent of the workforce. A firm-weighted survey therefore describes a population dominated by very small businesses, while an employment-weighted survey describes the experience of the average worker. Both are correct answers to different questions.
Question framing and materiality also change the result. The Federal Reserve Board analysis notes that BTOS originally asked about AI use in producing goods or services, wording intended to capture more material usage. In November 2025, the Census Bureau broadened the question to AI use in any business function, and the analysis cautions that respondents may still interpret the question as referring to more substantial use than other surveys capture.
Information asymmetry adds another source of variation. In the Census Bureau Business Trends and Outlook Survey (BTOS), the person answering for a firm may not know what colleagues are doing across the business. In the four BTOS surveys before year-end 2025, roughly 10 to 11 percent of respondents said they did not know.
Social desirability bias may also affect reported AI adoption. The April 2026 Federal Reserve Board FEDS Note argues that the direction of this bias may have changed over time: early respondents may have underreported use while organizations assessed security implications, while senior leaders may now face pressure to report AI use as an efficiency initiative. The note states that more research is needed to determine how meaningful this effect is.
For historical context, the April 2026 Federal Reserve Board FEDS Note cites earlier work reviewing 16 surveys that found mid-2024 estimates of work-related AI adoption ranging from about 5 to 40 percent. Wide dispersion in this measurement is therefore not unique to the 2025 and 2026 survey results.
Firm Adoption Is Still Far From Universal
Firm-level adoption reached about 18 percent by the end of 2025 and 19.8 percent by early May 2026 in Census Bureau data. Before the November 2025 question change, the rate had grown 68 percent, or 3.9 percentage points, over the year ending in September, with a deceleration in the second quarter of 2025.
Forward-looking responses add context to the level. At the start of 2025, around 9 percent of firms said they planned to use AI within six months, and by the end of June the observed adoption rate was in line with that expectation. More than 20 percent of firms expected to use AI in the first half of 2026. These planning responses are useful as a leading indicator, but they are still intentions rather than measured deployment.
By early May 2026, roughly one in five US businesses reported using AI in the Census Bureau Business Trends and Outlook Survey (BTOS). That firm-level measure is substantial but still far from universal, and it should not be compared with other technologies without a like-for-like adoption definition and timeframe.
Individual Use Is Running Well Ahead of Firm Adoption
One of the clearest patterns in the current data is the gap between worker-reported use and firm-reported adoption. Work-related generative AI use stood at about 41 percent of the labor force in November 2025, up 9.7 percentage points, or 31 percent, year over year. Non-work use reached about 50 percent of the population.
The worker-use and firm-adoption figures are not directly comparable because they use different units and survey designs. They show that individual-use measures and firm-level adoption measures can produce very different views of the same economy. For an organization, neither measure proves that AI use is governed, integrated into a workflow, or producing a measurable business result.
Usage Intensity Is Still Light
In the Real-Time Population Survey measures used here, adoption captures any reported work-related generative AI use, while intensity shows how frequently workers use the technology.
| Intensity measure | Source | Date | Level |
|---|---|---|---|
| Any work-related generative AI use | RPS | November 2025 | 40.7% |
| Used at least once in the past week | RPS | November 2025 | 35.2% |
| Used daily in the past week | RPS | November 2025 | 12.0% |
| Uses AI up to one hour per week | Atlanta Fed SBU | November 2025 | 35% of respondents |
| Uses AI one to five hours per week | Atlanta Fed SBU | November 2025 | 29% of respondents |
Daily work-related generative AI use in the Real-Time Population Survey (RPS) grew about 32 percent year over year but reached 12.0 percent in November 2025, well below the 40.7 percent any-use rate reported in the same survey. Most measured use was therefore not daily. That intensity gap is one reason an adoption count should not be treated as evidence of workflow-level value or financial impact.
Adoption by Firm Size
Across the surveys summarized by the Federal Reserve Board, AI adoption is generally higher among larger firms, although the legacy Census Bureau Business Trends and Outlook Survey (BTOS) also showed a distinctive pattern among the smallest firms. Census data from May 2026 put firms with at least 250 employees at 37 percent, against under 20 percent for firms with four or fewer employees, and Census reported that use increased among firms with 20 or more employees while remaining flat below that threshold.
In the legacy Business Trends and Outlook Survey (BTOS), the relationship between firm size and AI adoption was U-shaped, with relatively high rates among both the largest firms and the one-to-four-employee cohort. The revised series moderated that pattern: the smallest firms became more comparable to other sub-20-employee firms and remained below larger size classes.
The Federal Reserve Board analysis presents two possible readings of the firm-size pattern without choosing between them. Larger firms have more functions in which any AI use can qualify the company as an adopter, so adoption may be broad but shallow. The note also cites evidence consistent with AI lowering some barriers to starting and running very small businesses. Neither interpretation should be treated as a proven cause of the size pattern.
Adoption by Industry
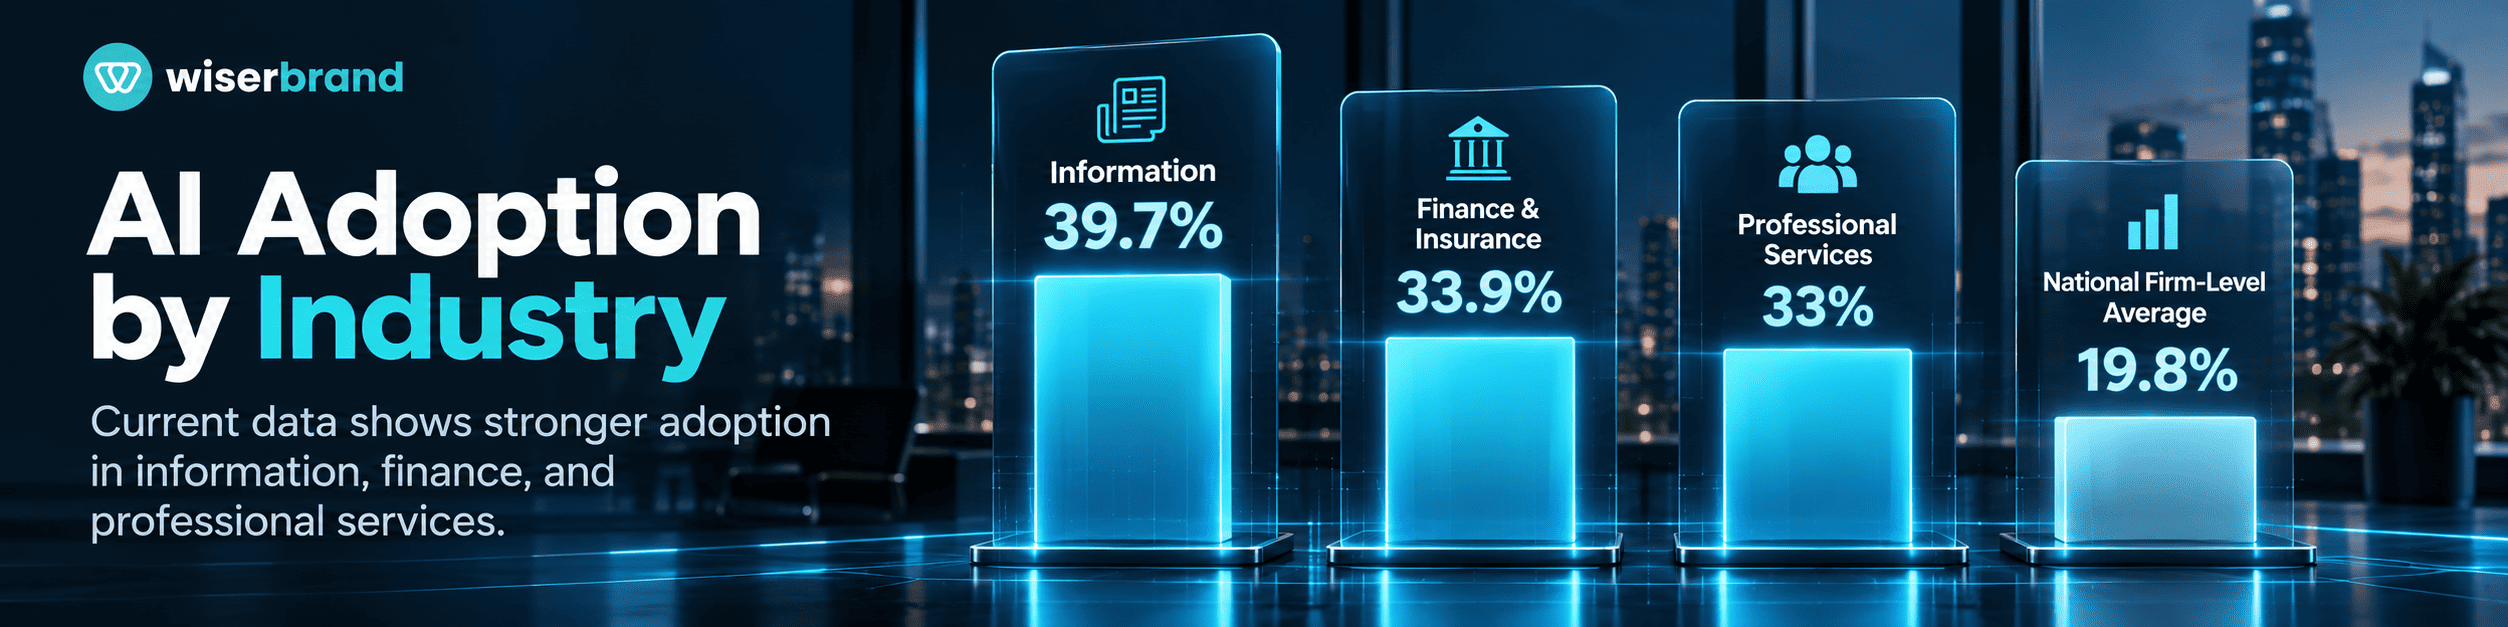
The April 2026 Federal Reserve Board FEDS Note compares the Census Bureau Business Trends and Outlook Survey (BTOS) with the Real-Time Population Survey (RPS) and finds larger industry differences than firm-size differences. Professional services and financial services stand out on both firm-level and worker-level measures.
| Industry | Firm-level adoption, BTOS, late 2025 | Worker-level generative AI use, RPS, November 2025 |
|---|---|---|
| Information | 37% | 70% |
| Professional, scientific, and technical services | 33% | 62% |
| Finance | 30% | 63% |
| Real estate, rental, and leasing | 24% | 58% |
| Wholesale trade | 13% | 48% |
| Accommodation and food services | 8% | 21% |
The April 2026 Federal Reserve Board FEDS Note reports firm-level adoption of about 33 percent in professional services and 30 percent in finance, while worker-level generative AI use reached 62 percent and 63 percent in those sectors. It also reports about 58 percent year-over-year worker-level growth in manufacturing and 127 percent growth in firm-level finance adoption over the year ending September 2025 in the legacy series. The authors interpret the pattern as consistent with early AI use being concentrated in more cognitive or analytical work, while noting that industry classification limits the comparison.
One classification caveat is worth carrying into any industry comparison. Pharmaceutical companies sit in manufacturing and life sciences research firms in professional services, so healthcare's apparent lag partly reflects how industries are coded rather than what those organizations do.
AI Spending Is Growing Rapidly, but Spending Measures a Different Layer
Gartner forecast worldwide AI spending at $2.59 trillion in 2026, a 47 percent increase from 2025. Its forecast puts AI services at about $586 billion and AI infrastructure above 45 percent of total spending.
Gartner's spending figures should not be compared directly with the 19.8 percent US firm-adoption rate or the 12 percent daily worker-use rate as though they share the same denominator. Gartner's market forecast measures global spending by category, while the adoption surveys measure firms or workers in the United States. Infrastructure spending, software spending, services spending, firm adoption, and daily use therefore describe different layers of the market.
The Gap Between Usage and Measured Value
AI adoption statistics do not measure business benefit. The April 2026 Federal Reserve Board FEDS Note cites research showing a gap between senior leaders' and workers' expectations about AI productivity gains and future employment, with senior leaders projecting stronger gains and lower employment. That difference is a reason to keep adoption and executive sentiment separate from measured workflow outcomes.
For planning, treat published adoption rates as evidence about diffusion, not as evidence about your own return. Claims about cost, cycle time, throughput, or revenue in a specific organization need a local baseline and post-deployment measurement because none of the adoption surveys cited here measures workflow-level business outcomes.
What to Watch Through the Rest of 2026
Four AI adoption indicators add more context than the headline adoption rate alone:
- Planned adoption in the Census Bureau Business Trends and Outlook Survey (BTOS), which the Federal Reserve Board analysis compares with observed firm adoption and which pointed above 20 percent for the first half of 2026.
- Daily usage in the Real-Time Population Survey (RPS), because a rising daily-use share would indicate that generative AI is becoming routine work rather than remaining occasional use.
- Adoption among firms with fewer than 20 employees in the Census Bureau BTOS, which remained flat through May 2026 while adoption increased among larger firms.
- The composition of Gartner's AI spending forecast, including the split between services and infrastructure. Spending mix shows where market investment is concentrated but does not prove how many firms have redesigned operating workflows.
The November 2025 Census question change already broke direct historical comparability. If survey wording or weighting changes again, treat the new result as a potential series break before making year-over-year claims.
How to Read Any AI Adoption Statistic
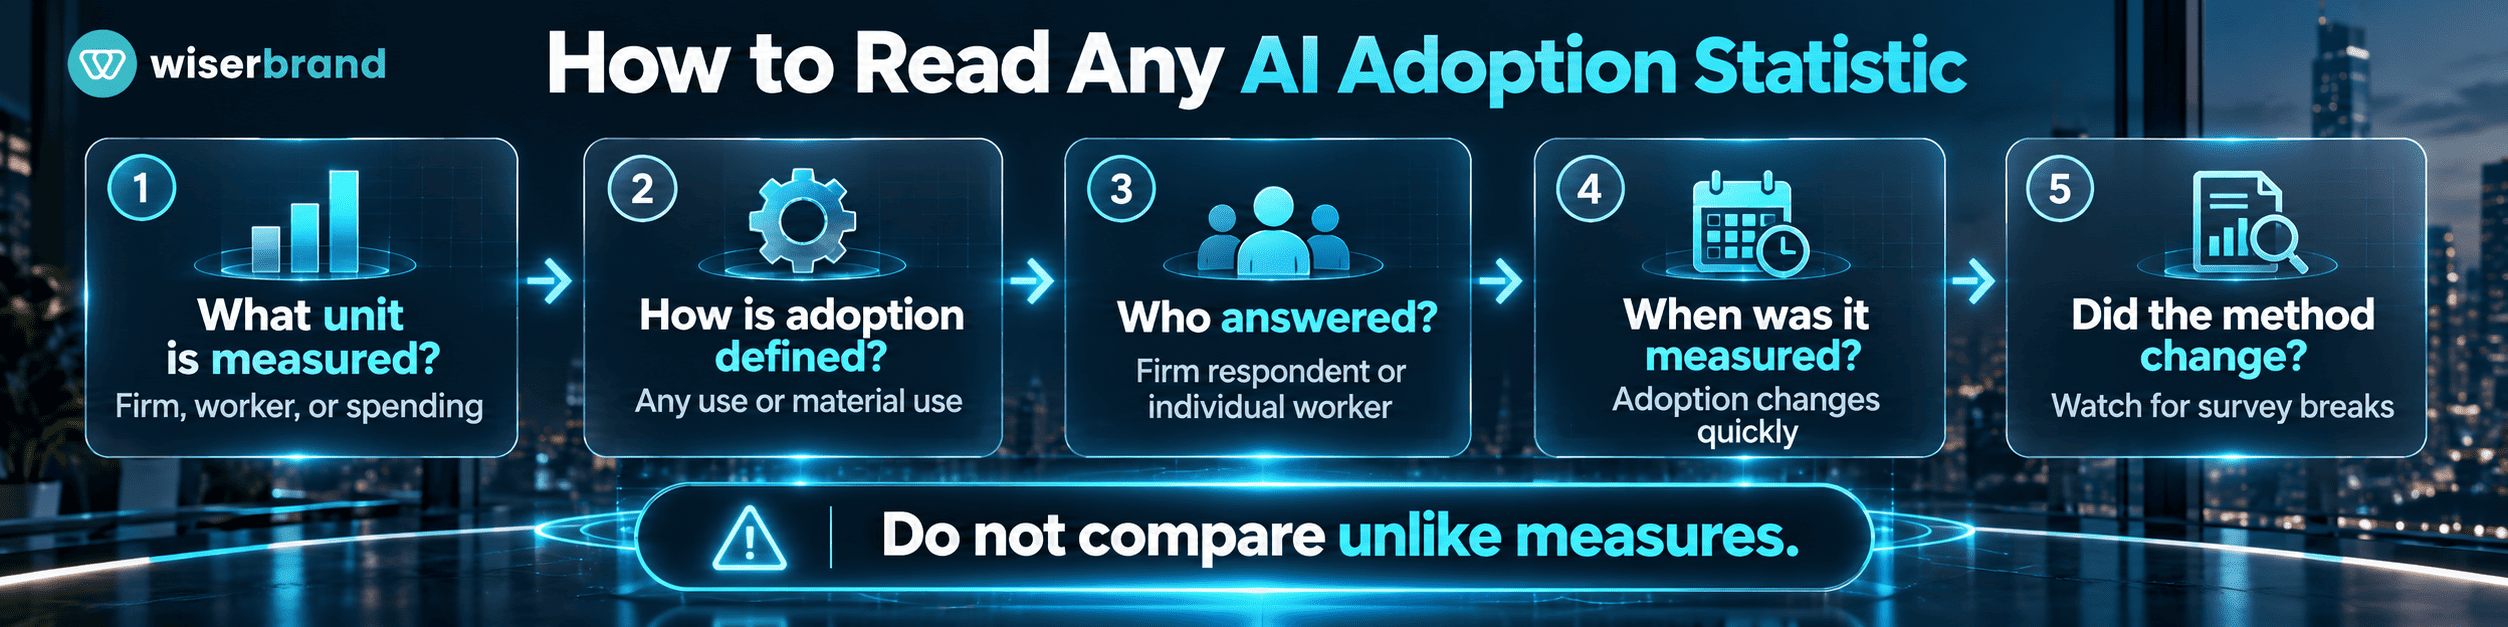
A five-question filter handles most of the misleading claims you will encounter:
- What is the unit, a firm, a worker, or a workflow? Firm-weighted and employment-weighted figures answer different questions.
- What counts as adoption? Any use at all, use in a specific function, or use that materially changes a process.
- Who answered? Executives, IT leaders, and individual workers may give different answers because they have different visibility into organizational use and different incentives when reporting it.
- When was it measured, and has the question wording changed? A series break makes year-over-year comparison invalid.
- Is this adoption or benefit? Most published figures measure the former and are quoted as though they proved the latter.
An AI adoption statistic is more useful for business decisions when its unit, definition, respondent group, measurement date, and methodology are clear. If a published figure omits those basics, treat it cautiously until the underlying source can be verified.
What AI Adoption Data Means for Business Planning
For large organizations, worker-level AI usage indicates substantial exposure to generative AI, but exposure is not the same as an operational workflow. A high share of employees using AI weekly does not identify which processes changed, which controls are in place, or which business metrics improved. Those questions require internal workflow measurement.
For small and mid-sized businesses, the Census data show lower adoption among firms with fewer than 20 employees than among larger firms as of May 2026. That difference is useful context, but it does not identify the cause. A smaller company should diagnose its own constraints, such as time, data quality, process clarity, or integration capacity, before deciding that more software or outside help is the answer.
For anyone building a business case, use the same sequence: record the current baseline, choose one workflow, measure the change, and use industry statistics as context rather than as evidence of your own return.
AI Adoption FAQ
What Percentage of Companies Use AI in 2026?
About 19.8 percent of US businesses reported using AI in Census Bureau data from early May 2026, compared with about 18 percent at the end of 2025. That figure is firm-weighted and therefore answers a business-count question. The Atlanta Fed's November 2025 survey estimated that roughly 78 percent of the labor force worked at firms that had adopted AI using employment weighting. The two numbers describe different units and should not be treated as competing estimates of the same thing.
How Many Workers Use AI at Work?
About 41 percent of the US labor force reported using generative AI for work in November 2025, up 9.7 percentage points year over year. Intensity was lower: 35.2 percent reported using generative AI at least once in the previous week and 12 percent reported daily use. The gap between any use and daily use matters because occasional usage does not show how deeply AI is embedded in a workflow.
Why Do AI Adoption Statistics Vary So Much?
Mainly because surveys measure different units and ask different questions. Firm-weighted surveys count businesses, employment-weighted surveys reflect where people work, and worker surveys ask individuals directly. Question wording, respondent knowledge, and possible social desirability bias add more variation. A comparison is valid only after those design differences are made explicit.
Which Industries Have the Highest AI Adoption?
Information, professional services, and finance are among the leaders in the current survey data. The April 2026 Federal Reserve Board FEDS Note reports about 33 percent firm-level adoption in professional services and 30 percent in finance in late 2025, with worker-level generative AI use at 62 percent and 63 percent respectively. Census data from May 2026 put Information at 39.7 percent and Finance and Insurance at 33.9 percent, both above the 19.8 percent national firm-level rate.
Is AI Adoption Growth Slowing Down?
Firm-level growth decelerated in the second quarter of 2025 before the Census question change, while worker-level generative AI adoption posted the strongest quarterly growth of its series in late 2025. The measures moved differently, and the November 2025 question revision broke the firm-level series. Several quarters of the revised survey are needed before making a strong claim about the new trend.
How Big Is the AI Market in 2026?
Gartner forecast worldwide AI spending at $2.59 trillion in 2026, up 47 percent year over year, with infrastructure as the largest category and AI services at about $586 billion. Gartner also states that vendors and hyperscalers dominate current spending. Those figures describe the market for AI products and infrastructure; they are not a direct measure of how many enterprises have integrated AI into operating workflows.
Final Thoughts
Current AI adoption statistics describe several different layers: worker use, firm adoption, usage intensity, industry distribution, and global spending. The main lesson is methodological. A business should not collapse those measures into one maturity score or use a national adoption rate as proof that a particular workflow will create value. Before using any benchmark, identify the unit being measured, the adoption definition, the respondent group, the measurement date, and any break in survey methodology.
Use market data to calibrate expectations, then measure the selected workflow against an internal baseline. Record the current cycle time, manual handling, error or rework rate, and business outcome before deployment, then compare the same measures after a controlled pilot. If a use case needs custom system connections or workflow logic after the adoption decision is made, custom AI development services can support that implementation. The business case should still rest on the organization's own baseline rather than a market-wide adoption percentage.